Urban Stormwater Generation
Urban Runoff Generation
The majority of stormwater runoff in urban catchments is generated from the impervious surfaces. Baseflow, influenced by sub-surface soil moisture and groundwater levels, is less dominant in urban catchments as is evident from the "flashy" nature of urban stormwater hydrographs.
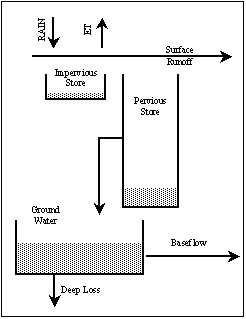
The algorithm adopted to generate urban runoff is based on the model developed by Chiew & McMahon (1997). The model was a simplified description of the rainfall-runoff processes in catchments involving the definition of the impervious area and two soil moisture storages. That model, which was initially developed as a daily model, was simplified for MUSIC as shown in Figure 1, and modified to enable disaggregation of the generated daily runoff into sub-daily temporal patterns and has been shown to be suitable for a range of catchments in Australia, UK, Europe and Asia with appropriate calibration.
The default values adopted for MUSIC are based on calibration of the model to typical urban catchments (further guidance is available in the Appendices). It should be noted that the volume of runoff generated and the stormwater runoff time series from an urban catchment are not very sensitive to variation in the parameters defining the pervious area response to rainfall, except where directly connected imperviousness percentages are low, and the model is significantly more sensitive to the accurate definition of the fraction imperviousness and the selection of simulation time-step.
Figure 1. Conceptual Rainfall-Runoff Model adopted for MUSIC (after Chiew & McMahon, 1997)
Urban Pollutant Load relationships
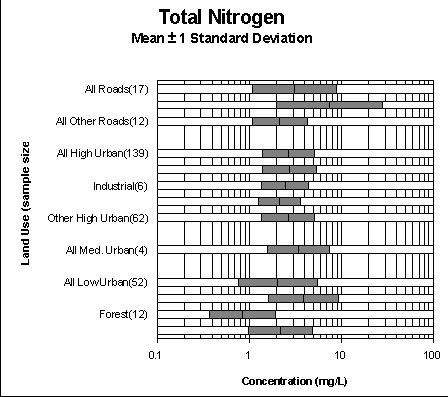
A comprehensive review of worldwide stormwater quality in urban catchments was undertaken by Duncan (1999). This review supplemented by local data specific to regional applications has formed the basis for default values of event mean concentrations for Total Suspended Solids (TSS), Total Phosphorus (TP) and Total Nitrogen (TN) adopted in MUSIC. These water quality constituents, together with gross pollutants are the only pollutants fully modelled in MUSIC (ie. with appropriate generation and treatment parameterisation). This current version of MUSIC includes the ability to "swap" a pollutant for another, and allows simulation of a wider range of pollutant types, however, this should be done where sufficient data is available to characterise both generation and treatment performance.
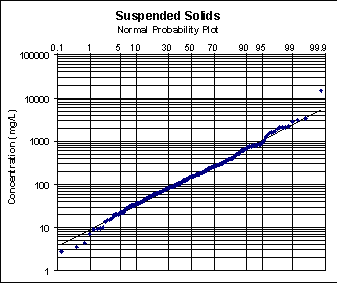
Analysis by Duncan (1999) found even mean concentrations of TSS, TP and TN to be approximately log-normally distributed for a range of different urban land-use. A sample normal probability plot (for TSS) is shown in Figure 2 below. The means of the Dry Weather Concentration (DWC) and Event Mean Concentration (EMC) data have been adopted as default parameters in the model. The standard deviations of the DWC and EMC data reflect the influence of both spatial and temporal factors and are considered to be larger than that applicable at any individual site. Therefore default standard deviations of dry weather and (storm) event mean concentrations of TSS, TP and TN adopted in the model are scaled by 67% and 33% for event flow and dry weather (baseflow) parameters respectively, based on limited analysis of stormwater quality data for an urban catchment in Melbourne.
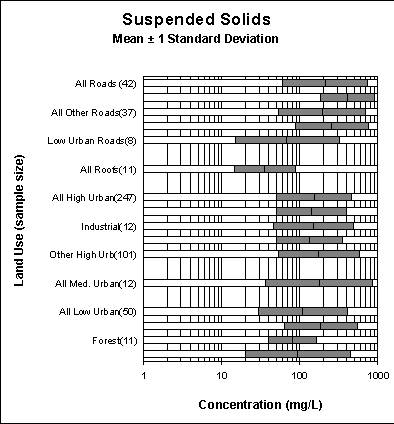
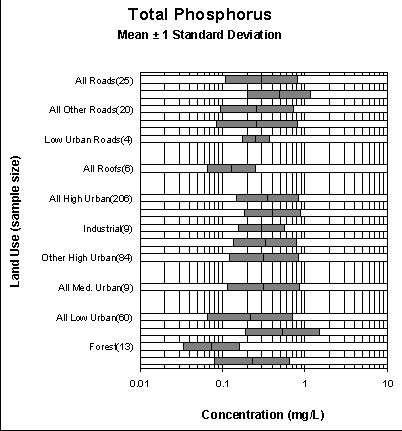
You can change the parameters of the log-normal distribution of each pollutant type, (refer to Figure 3 to Figure 5 and Duncan (1999) for more information). MUSIC uses a stochastic generation approach, deriving concentrations for TSS, TP and TN at each time-step from the distribution described by the mean and standard deviation for each.
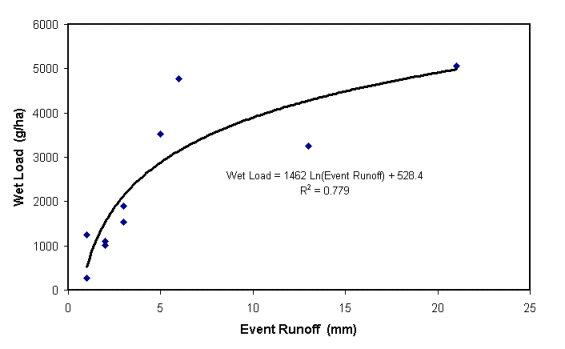
Gross pollutant load generation was adapted from field monitoring data of Allison et al. (1997) for 12 storm events in an inner city suburb as shown in Figure 6.
