Feature Table
The main purpose of the Feature Table is to allow review and management of model parameters. For some model components, it is possible to access and set some model parameters via the feature table. The model components that can been accessed via the feature table are being progressively expanded.
The Feature Table allow the user to:
- Viewing a summary of scenario components in a selected project. This includes most nodes, links, functions, ownership, and, resource assessment;
- Edit pre-configured parameters of individual components, such as numerical values and data inputs (functions and time series);
- Access the Feature Editors for nodes and links
Once a schematic scenario has been created, the Feature Table can be accessed by choosing Edit » Feature Table....
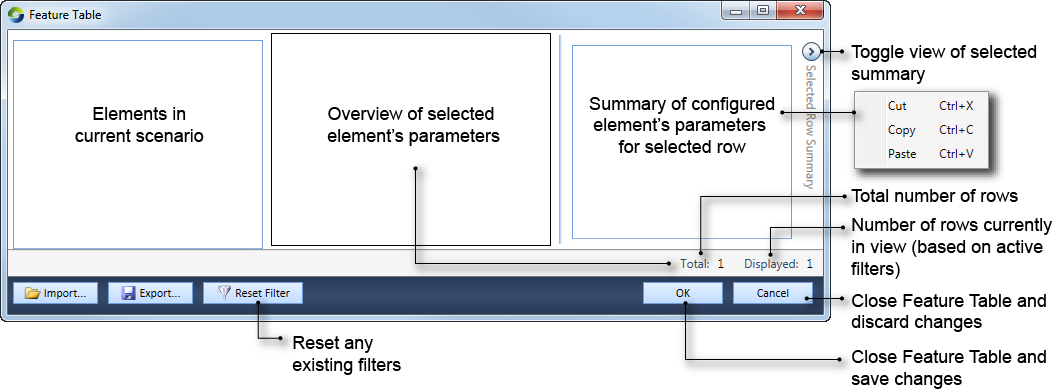
Figure 1 shows the components of the Feature Table.
Figure 1. Components of the Feature Table
Components
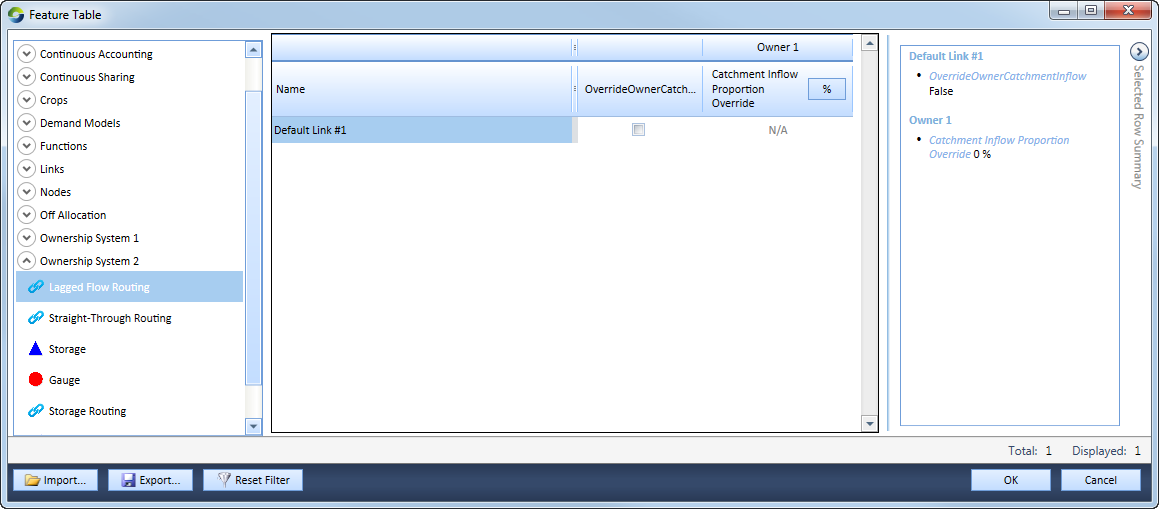
The Feature Table (Figure 2) comprises of a total of two/three columns:
- The left-most column lists the elements in the current scenario that can be viewed via the Feature Table - this includes most nodes, links, input data (such as functions), including features that have been enabled (such as ownership and resource assessment);
- When an element is selected in the first column, the second column provides an overview of its configured parameters; and
- The third column appears when the toggle icon is turned on; it shows individual parameter values.
Attributes of the Feature Table
The feature table allows you to edit a number of elements of the same type at once in a table. e.g. all Storage nodes or all Inflow nodes.
- A tool tip appears when you hover over a column header, showing the parameter's full name;
- The ability to filter on a particular column - this is very useful when a scenario has a large number of nodes such as multiple water user demand model types. Refer to the sections below for details;
- The ability to enable/disable checkboxes of individual nodes in their associated feature editors.
- If you specify invalid values for specific cells, they will be saved when you click OK and an error will occur when you try to run the model. For example, the Maximum Extraction Rate of a Supply Point node cannot be a negative number, if it is set to a negative number in the feature table, when the model is run an error appear that says "Maximum extraction rate has to be greater than or equal to 0ML/day";
- If available (and relevant), you can change units in a column. Hover on the Units button in the column header and choose the required units from the drop-down menu;
- You can import and export .csv files in the Feature Table. Refer to the respective sections below for details;
- The ability to copy and paste columns and rows. Use the Shift key in conjunction with the arrow keys to choose multiple rows and/or columns. Alternatively, you can click and drag the mouse to choose multiple cells. Press Ctrl+C to copy the cells, then (Ctrl+V and Shift) to paste in the required cells. You can also copy text from the Summary column. For the equivalent operation in catchments, click Apply Value(s) To All Rows (as shown in the Rainfall Runoff Model Configuration dialog); and
- Some columns provide a read-only view of the node/link - these are parameters that cannot be changed in the Feature Table. Clicking on Feature Editor… will open the associated node’s feature editor alone.
Figure 2. Feature Table, example
Working with filters in the Feature Table
You can have multiple filters active at once. To open the filter dialog:
- Hover your mouse pointer on the column header until a drop-down arrow appears; and
- Click on the arrow to open the dialog.
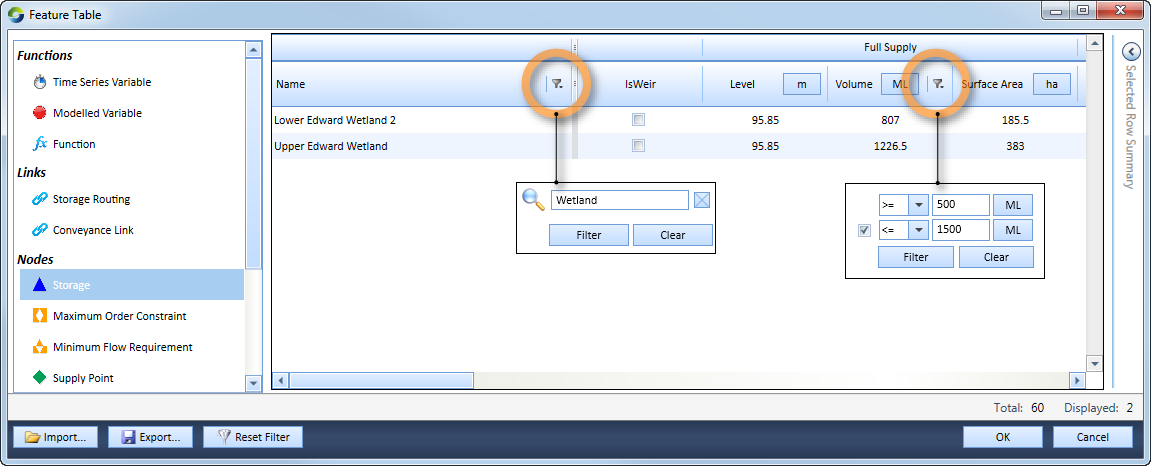
Once a filter is active, an icon appears in the column header indicating that a filter is active for that column. The example in Figure 3 shows what type of filters are active - in this case, the Name and Volume columns.
Figure 3. Feature Table, filtering on multiple columns
Filtering on numerical values
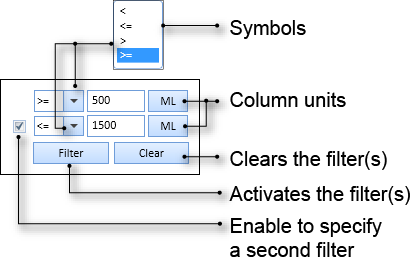
To filter on columns that have numerical values, open the filter dialog (as described above) and specify its parameters (shown in Figure 4):
- Specify the first filter using the Symbols drop-down menu and enter a numerical value;
- If you wish to change the units, click on the column units button and specify the required units;
- Enable the checkbox if you wish to define the second filter; and
- Click Filter to enable the filter. The result will appear in the Feature Table.
Figure 4. Feature Table, filtering on numerical values
Filtering on names
You can filter based on the Element Type name:
- Open the filter window (Figure 5);
- Enter the required string in the text field; and
- Click Filter.
Figure 5. Feature Table, filtering on names
Importing
- Columns and rows may be in a different order prior to importing. Note that column and row headers should match exactly to ensure the correct operation;
- You can import more columns than is visible in the Feature Table. This is applicable when filtering has been turned on; and
- Read-only columns are not imported.
Exporting
- Only visible rows and columns in the parameter overview are exported. So, if filtering is turned on, the filtered rows and columns will be exported;
- The column title of the exported file is a combination of the top-level header and the column header of the Feature Table (refer to Figure 1); and
- The Feature Editor column is not exported.


