Stormwater Treatment Trains
The life cycle costing module in music allows users to generate a cumulative life cycle cost (and an equivalent annual payment) estimate for any point in a stormwater treatment train.
To do this, firstly check the life cycle estimates for each treatment node in the treatment train, then set the ‘span of analysis’ to the largest of these values (e.g. 50 years). To set the span of analysis, select Costing Properties menu item from the Edit menu and manually enter the value in the relevant entry field. This step must be done to ensure music calculates a life cycle cost for each treatment device in the treatment train over the same time span (e.g. 50 years), so these life cycle costs (or equivalent annual payments) can be added together.
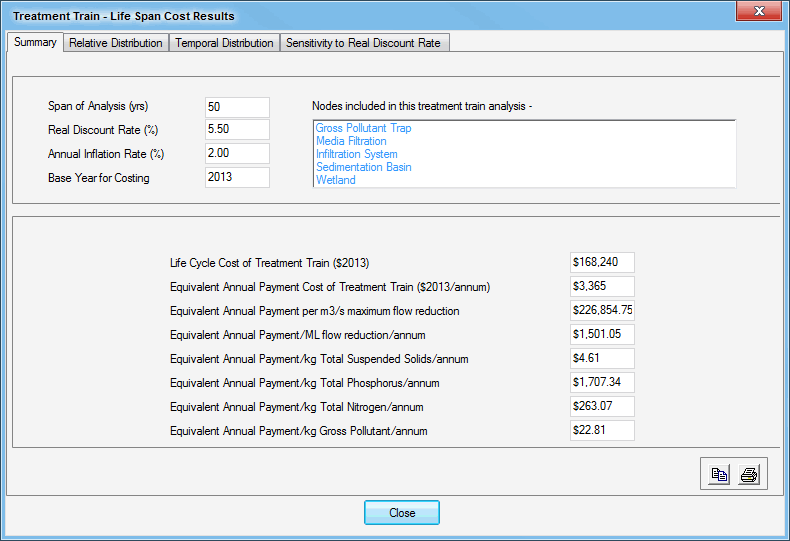
To undertake the life cycle costing analysis, select the treatment node at the end of the treatment train being analysed, right click the mouse button on the icon and select the Treatment Train menu item from the Life Cycle Costing menu in the pop-up menu. The following screen should appear.
This screen presents the key results from the life cycle costing analysis in a similar manner to the summary results screen for individual treatment notes, but also includes a list of nodes in the treatment train that have been included in the costing analysis.
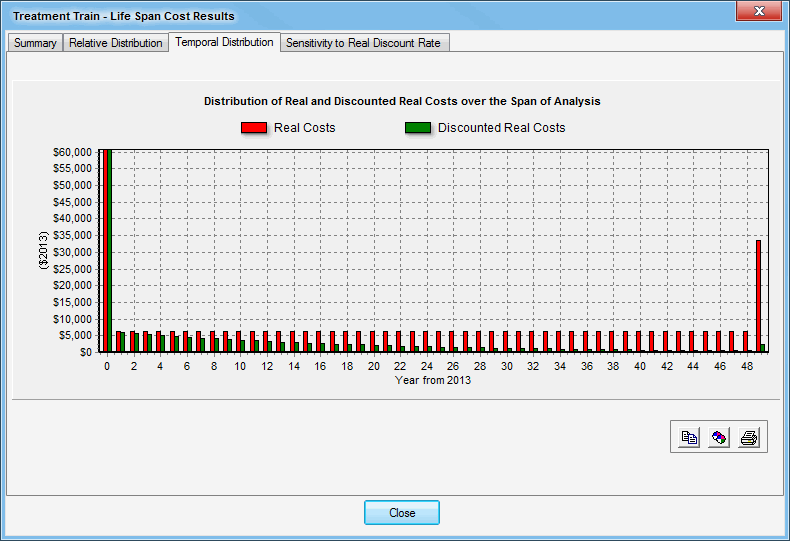
To check that the life cycle cost model is operating as expected, check the temporal distribution results screen by selecting the Temporal Distribution tab at the top of this screen. An example is given below involving a stormwater treatment train that consists of a release net gross pollutant trap with a life cycle of 10 years and a constructed wetland with a life cycle of 50 years. The span of analysis has been set at 50 years.
The results presented in the screen above, show that the release net gross pollutant trap has five life cycles over the 50 year ‘span of analysis’, while the wetland only has one (as expected). The treatment train’s life cycle costing model therefore appears to be operating as expected.
The Relative Distribution and Sensitivity to Real Discount Rate result screens provide similar information to that already discussed for individual treatment nodes (see Life-Cycle Costing - Constructed Wetlands for details).


