Note: This is documentation for version 4.3 of Source. For a different version of Source, select the relevant space by using the Spaces menu in the toolbar above
NetLP debugging
- Meryl McKerrow
- SysAdmin eWater
Inspecting an arc-node network (advanced)
It is possible to visualise the arc-node networks that are generated by Source. However, you will first need to download and install a third-party software package called Graphviz. The home page for this application is:
Choose the current stable release in preference to any development snapshots. Consult your Windows system administrator if you need help installing Graphviz.
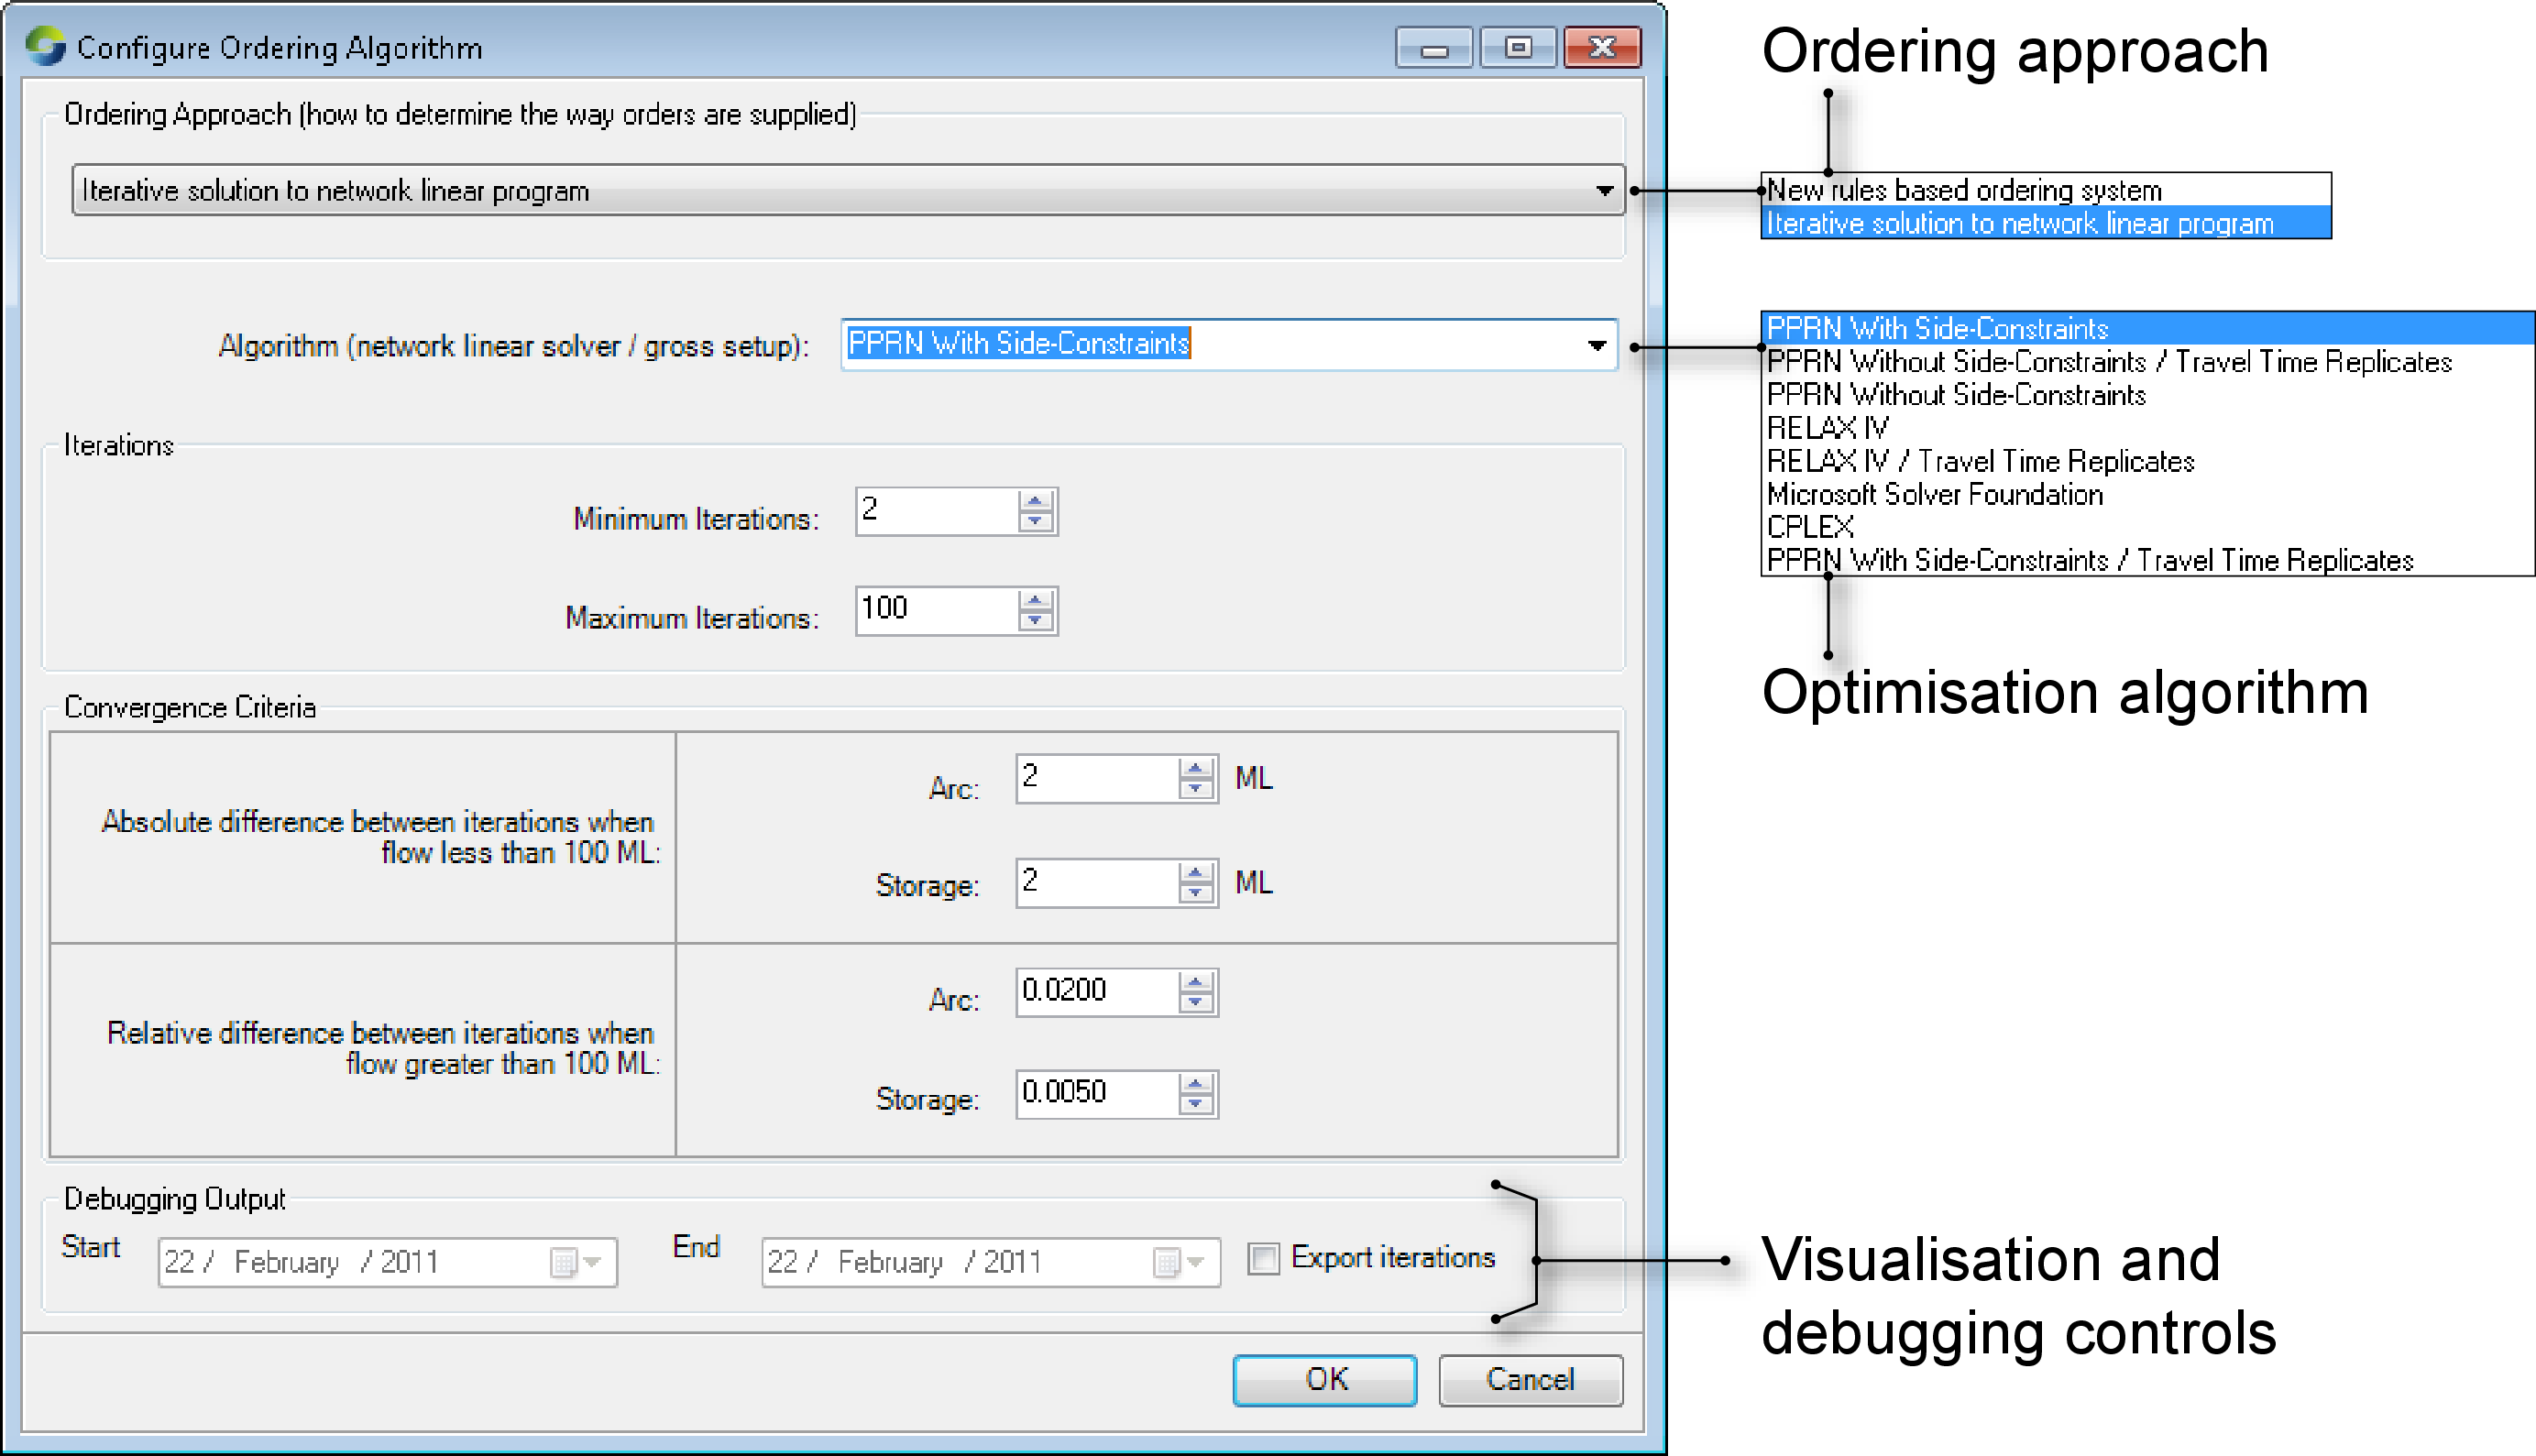
To enable debugging and visualisation support in Source:
- Choose Edit » Ordering Algorithm...;
- Enable Export iterations;
- If your model operates over a large number of time-steps, you may wish to restrict the date-range for which arc-node output is produced using the Start and End date controls in this dialog; and
- Click OK.
Next, run your model. Enabling Export iterations creates a folder on your Desktop with a name in the pattern:
MspNetworkOutput-yyyy-mm-dd
At the end of a run, this folder will contain three files per time-step:
- A visual representation (.DOT) of the arc-node network suitable for display in Graphviz;
- A textual representation of the arc-node network; and
- A textual representation of the test case for that time-step.
To visualise an arc-node network for a given time-step:
- Use the Windows Start menu to launch Gvedit, which is part of Graphviz;
- Choose File » Open and select the .DOT file of interest. Gvedit will respond by opening a textual representation of the arc-node network as shown in the central window in Figure 7; and
- Click the Run button on the Gvedit toolbar (Figure 7).
Figure 7. Gvedit (opening an arc-node network)

Graphviz always generates a graphical representation of your arc-node network in two forms. One is displayed on your screen and the other is saved as a file. By default, the version saved as a file is in .GIF format but you can change this using the Output File Type pop-up menu in Figure 8. Note that Graphviz can also generate high-resolution vector-based representations such as .SVG.
By default, the file is saved in the same folder as the original .DOT file. You can change this by clicking the ellipsis button (...) to the right of the Output File Name field in Figure 8.
Figure 8. Graphviz settings dialog

Once the settings have been configured to your requirements, click OK. Figure 9 is an excerpt from an arc-node network diagram produced by Graphviz. The elements inside the blue rectangle correspond with a Splitter node in the original Source schematic.
Figure 9. NetLP arc-node network for Splitter node
