User interface reference
Introduction
This section provides an overview of each menu, sub-menu and toolbar command available in the Source main menu. It also acts as a good reference point when you become familiar with Source. Click on the text in parentheses to link to the associated user guide section.
Menus
The menu bar for Source is shown in Figure 1 and is like the standard Windows™ menu bar. This section outlines the function of each menu item.
Figure 1. Menu bar

Figure 2. File menu
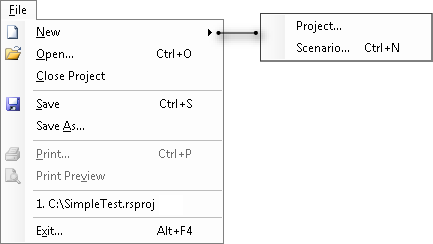
Creates a new, empty project. Opens the Create a project dialog where you can name your project, provide a brief description of its purpose and choose the type of scenario you wish to create.
Attaches a new, empty scenario to the current project. Opens the Create a Scenario dialog which offers a choice of the Geographic wizard or creating a Schematic scenario. Select the type which is appropriate to your needs. Name your scenario and provide a brief description of its purpose and click OK. This command is a synonym for New Scenario (by menu) on the Project Explorer toolbar.
In the absence of an open project, implies creating a new project.
Opens an existing project using the standard Windows™ open dialog. Synonym for Open Project on the File toolbar. Source projects use the ".rsproj" and ".rsproj.xml" extensions but can also open legacy project types ".e2proj" and ".mdb".
Closes the current project. Prompts to save your work. Click Yes to save your work, No to discard any changes, or Cancel to return to Source.
Saves the current project, overwriting the existing file. Synonym for Save Project on the File toolbar. Implies if the project has never been saved.
Opens a standard Windows™ save dialog which allows you to:
- Enter a name for your project; and
- Determine where the file will be saved.
Source projects use the ".rsproj" or ".rsproj.xml" extensions.
This command is currently disabled. However, the Print (Schematic Editor grid toolbar) button on the Schematic Editor grid toolbar may be used to print schematic scenarios.
This command is currently disabled. However, the Print (Schematic Editor grid toolbar) button on the Schematic Editor grid toolbar may be used to print scenario schematics. Clicking that button also provides a preview.
This area contains a list of recently-saved projects. You can re-open any project by choosing its name from the list in this area.
Quits Source. You are asked to confirm your intention and reminded to save any unsaved work.
Figure 3. Edit menu
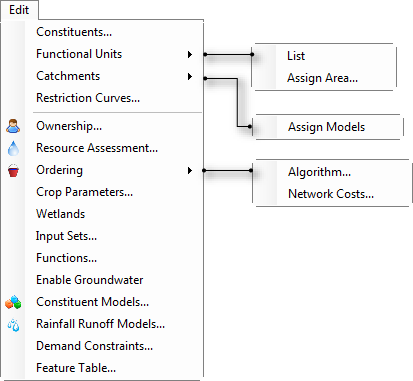
Opens the Constituents Configuration modal dialog (Constituents).
Opens the Edit Scenario Configuration modal dialog where you can inspect the list of existing functional units. You can also use this dialog to add new functional units or delete functional units that are no longer required. This dialog is only available when a catchments scenario is active (Specify FU).
Opens the Edit Scenario Configuration modal dialog where you can associate sub-catchments with functional units. This dialog is only available when a catchments scenario is active (Specify FU area).
Opens the Edit Scenario Configuration modal dialog where you can assign constituent models at the whole catchment level. This dialog is only available when a catchments scenario is active (Assign catchment models).
Opens the Restriction Curves Explorer dialog where you can edit restriction curves (Restriction Curves).
Opens the Ownership Setup dialog where you can manage ownership in a scenario. This dialog is only available when a schematic scenario is active.
Opens the Resource Assessment Explorer dialog where you can manage resource assessment in a scenario. This dialog is only available when a schematic scenario is active.
Opens the Configure Ordering Algorithm dialog.
Opens the Cost Functions dialog.
Opens the Crop Parameters dialog where you can configure crops for use at the water user node.
Opens the Wetland Configuration dialog where you can edit the wetlands solver configuration.
Opens the Input Sets dialog where you can manage input sets.
Opens the Function Editor dialog where you can edit functions.
Allows you to explicitly enable/disable groundwater in a scenario.
Opens the Constituent Model Configuration modal dialog where you can assign and work with constituent generation and constituent filter models. This dialog is only available when a catchments scenario is active.
Opens the Rainfall Runoff Model Configuration modal dialog where you can assign and work with rainfall runoff models. This dialog is only available when a catchments scenario is active.
Opens the Demand Constraints modal dialog where you can view all configured demand constraints.
Opens the Feature Table modal dialog where you view parameters for each of the configured nodes in the scenario.
Figure 4. View menu
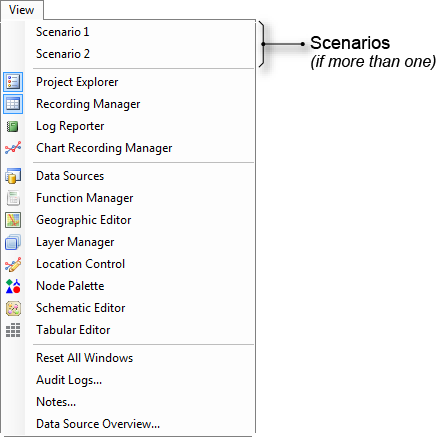
Many of the commands in this menu control whether a window is visible on your screen. The commands act as toggles:
- If a window is visible when the command is chosen, the window will be hidden.
- If a window is hidden when the command is chosen, it will become visible.
The commands remember the location of a window while it is hidden:
- If a window is docked before being hidden, it will remain docked in the same location when it is again made visible. Other docked windows within the main window will expand or shrink accordingly.
- If a window is undocked before being hidden, it will remain undocked in the same location when it is again made visible.
Toggles whether the Project Explorer is visible on screen. Synonym for Project Explorer on the Project toolbar.
Toggles whether the Recording Manager is visible on screen. Synonym for Recording Manager on the Project toolbar.
Toggles whether the Log Reporter is visible on screen. Synonym for Log Reporter on the Project toolbar.
Toggles whether the Chart Recording tab is visible on screen. Synonym for Chart Recording Manager on the Project toolbar.
Toggles whether the Data Sources Explorer is visible on screen. Synonym for Data Sources on the Project toolbar.
Toggles whether the Function Manager is visible on screen. Synonym for Function Manager on the Project toolbar.
Toggles whether the Geographic View is visible on screen. Synonym for Geographic Editor on the Scenario toolbar.
Toggles whether the Layer Manager is visible on screen. Synonym for Layer Manager on the Scenario toolbar.
Toggles whether the Location Control is visible on screen. Synonym for Location Control on the Scenario toolbar.
View » Node Palette
Toggles whether the Node Palette is visible on screen. Synonym for Node Palette on the Scenario toolbar.
Toggles whether the Geographic Editor, Schematic Editor and Tabular Editor tabs are visible on screen. Synonym for Schematic Editor on the Scenario toolbar.
Toggles whether the Tabular Editor tab is visible on screen. Synonym for Tabular Editor on the Scenario toolbar.
Restores the default arrangement of Source windows. Requires an active scenario. Affects the Node Palette, and the Geographic, Schematic and Tabular editors. If an affected window is undocked, it will be re-docked. If an affected window was auto-hidden, that feature will be turned off. Any affected window that has been moved will be restored to its default location.
Opens the Audit Logs Viewer.
Opens the Notes dialog showing all 'post-it' type notes that have been added to nodes and links in the current scenario.
Opens the Data Sources Overview dialog showing a summary of all data sources in the current scenario.
Figure 5. Run menu
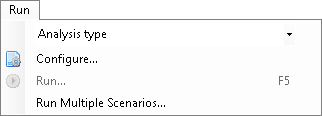
Selects the type of analysis to be performed. Synonym for Select Analysis Type on the Simulation toolbar. See Running scenarios and Forecasting.
Opens a configuration window for the selected analysis type where you can set parameters to control the run (eg. date-range). Synonym for Configure on the Simulation toolbar. See Running scenarios and Forecasting.
Performs the selected analysis. Synonym for Begin Analysis (Run) on the Simulation toolbar.
Opens the Run Multiple Scenarios window.
Figure 6. Tools menu
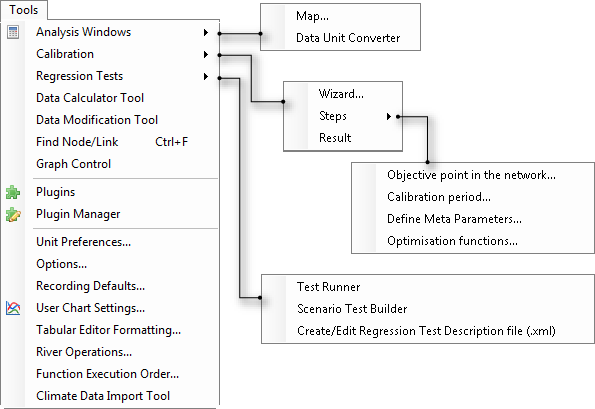
Displays a spatial map of the constituent loads per sub-catchment. See Mapping Analysis window.
Converts data from one unit type to another.
Launches the calibration wizard for catchments. Synonym for clicking Configure on the Simulation toolbar (or choosing ) when Select Analysis Type is set to RR Calibration Analysis. See also Calibration Wizard for catchments.
Opens the recordable element selection panel of the calibration wizard for catchments. This panel should be treated as read-only.
Opens the period definition panel of the calibration wizard for catchments. This panel should be treated as read-only.
Opens the metaparameter definition panel of the calibration wizard for catchments. This panel should be treated as read-only.
Opens the optimisation function configuration panel of the calibration wizard for catchments. This panel should be treated as read-only.
Opens the optimisation results window. This window is populated by a run of the calibration wizard for catchments. See also Inspecting calibration results.
Opens the Test runner dialog where you can run various tests on scenarios.
Tools » Regression Tests » Create/Edit Regression Test Description file (.xml)
Opens the Add Regression Test Project dialog where you can run various tests on scenarios.
Opens the Data Calculator dialog.
Opens the Data Modification Tool dialog.
Opens the Find dialog. Synonym for Ctrl+F. See Searching for nodes and links.
Opens a standard file-save dialog where you can export an XML representation of your project. For best results, use Internet Explorer 9 or above, or Firefox 5 or above. These will open XML in a browser.
Allows access to some of the plugins added using the Plugin Manager.
Opens the Plugin Manager modal dialog that allows you to add and remove plugins in Source .
Opens the Units Preferences window (see Unit preferences).
Opens the Options dialog.
Opens the Set Recording Defaults dialog. See also Recording Manager defaults.
Opens the Graph Settings dialog. This is a global setting allowing you to customise charts before they are produced. To customise an individual chart, access the Edit graph properties button from the toolbar on the chart itself.
Opens the Edit Tabular Formatting Settings modal dialog. Refer to the chapter on User preferences.
Opens the River Operations modal dialog where you can manage forecasting for a scenario.
Opens the Function Execution Order dialog showing the order in which expressions are processed.
Opens the Climate Data Import Tool modal dialog where you can specify climate data for a catchments scenario.
Figure 7. Help menu
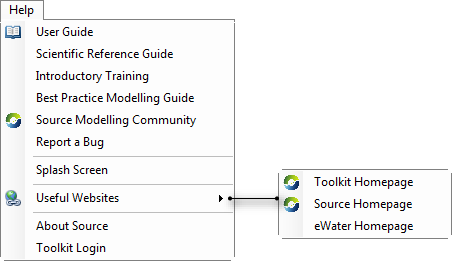
Launches your browser with a URL to the online Source User Guide.
Launches your browser with a URL to the online Scientific Reference Guide.
Launches your browser with a URL to the latest available Source training.
Launches your browser with a URL to the Guidelines for Water Management Modelling. Available here.
Launches your browser with a URL to the Source Modelling Community web site.
Launches your browser with a URL to the eWater web site where you can report a bug.
Opens the Source splash screen (synonymous to opening Source for the first time).
Launches your browser with a URL to the Toolkit web site.
Launches your browser with a URL to the Source web site.
Launches your browser with a URL to the eWater web site.
Opens a window containing product and license information.
Opens the Toolkit Login dialog where you can create a toolkit login or enter your credentials if you have one.
Toolbars
Toolbars in the main window offer shortcuts to their equivalent menu commands.
Figure 8. Data Sources toolbar
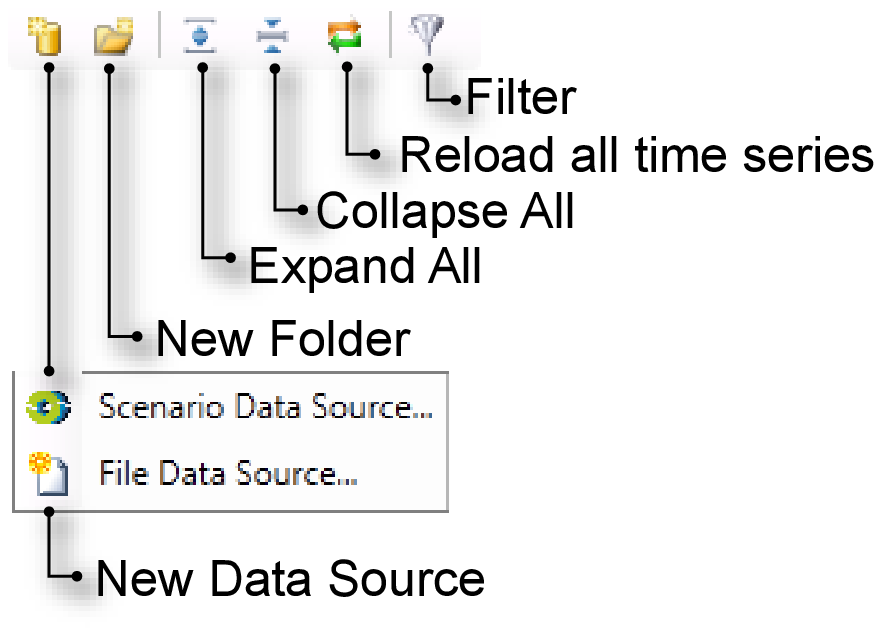
New Data Source
Creates a new data source, using either the output of a scenario (Scenario Data Source...) or a time-series file (File Data Source...).
New Folder
Creates a new data folder within the data source
Expand All
Expands the file hierarchy
Collapse All
Collapses the file hierarchy
Reload all time series
Reloads all time series when Reload on Run is selected
Filter
Filters out all data items with incompatible units
Figure 9. File toolbar
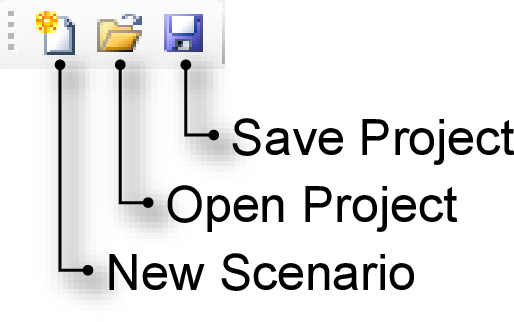
New Scenario
Creates a new, empty scenario. Synonym for both and New Scenario (by menu) on the Project Explorer toolbar.
Open Project
Opens an existing project. Synonym for
Save Project
Saves the current project, overwriting the existing file. Synonym for Implies if the project has never been saved.
Figure 10. Functions toolbar
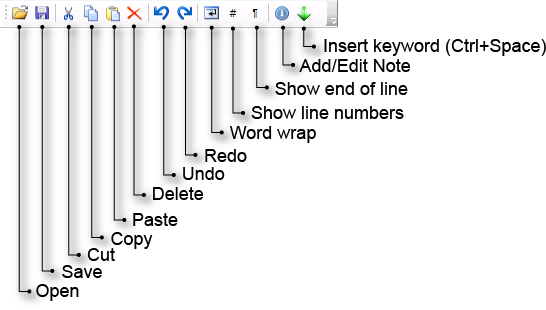
Open
Opens an existing function (as a text file) from your specified location on the computer.
Save
Saves the function to your computer as a text file.
Cut
Cuts the selected text and places in your computer's clipboard
Copy
Copies the selected text to your computer's clipboard.
Paste
Pastes the selected text. Enabled after either a Cut or Copy.
Delete
Deletes the selected text.
Undo
Undoes the previous action.
Redo
Enabled after the Undo action. Re-does the Undo action.
Word wrap
Wraps a function to make it entirely visible on a single screen.
Show line numbers
Displays the line number in front of the line.
Show end of line
Displays an end of line character for the function.
Add/Edit Note
Allows you to add a new note, or edit an existing one for the function.
Insert keyword (Ctrl+Space)
Inserts a keyword into the function. Synonym for pressing Ctrl+Space on your keyboard.
Figure 11. Function manager toolbar
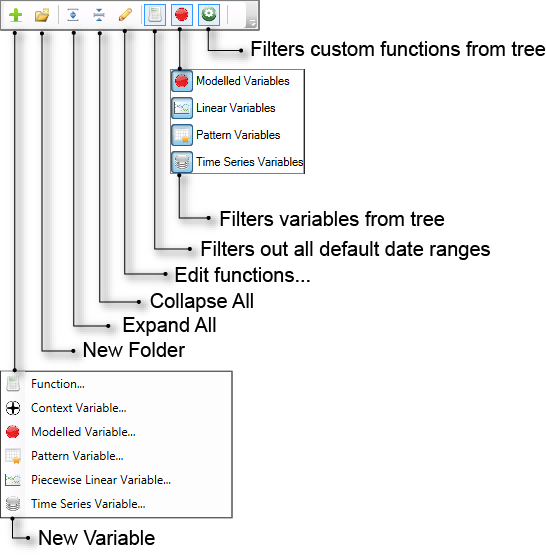
New variable
Creates a new variable of type as selected:
- Function;
- Context variable;
- Modelled variable;
- Pattern variable;
- Piecewise linear variable; or
- Time series variable.
New folder
Creates a new folder in the function tree.
Expand All
Expands all folders in the function tree.
Collapse All
Collapses all folders in the function tree.
Edit functions...
Opens the Function Editor.
Filters out all default date ranges
Toggles view of all functions/expressions.
Filters variables from tree
Toggles view of the variable type in the function tree. You can choose to view variables of type:
- Modelled variable;
- Pattern variable;
- Piecewise linear variable; or
- Time series variable.
Filter custom functions from tree
Toggles view of all custom functions in the function tree.
Figure 12. Geographic Editor toolbar
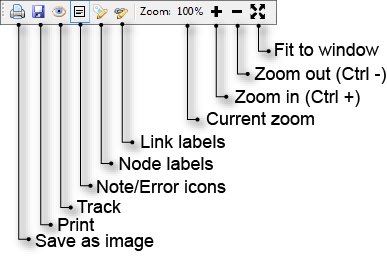
Save as image (Geographic Editor toolbar)
This button prepares the Geographic Editor for saving in JPEG format. The command opens a standard file dialog box so that you can choose where to save the image. At present, the entire schematic is scaled to fit within a single A4 page in portrait mode.
Print (Geographic Editor toolbar)
This button formats the Geographic Editor for printing and opens the Print preview dialog. At present, the entire schematic is scaled to fit within a single A4 page in portrait mode.
Track (Geographic Editor toolbar)
This button controls whether the Geographic Editor always scrolls to show components as they are selected in the Project Hierarchy.
The default state of this button is off. In this mode, Source leaves the Geographic Editor window unchanged, regardless of any selections you may make in the Project Hierarchy.
If you turn Track on, the Geographic Editor window will scroll to bring into view any node or link that you select in the Project Hierarchy. You can use this feature to locate components in large models.
Note/Error icons (Geographic Editor toolbar)
This button toggles view of any notes and/or errors that are present in the Geographic Editor.
Node labels (Geographic Editor toolbar)
This button controls whether the names of nodes are shown in the Geographic Editor.
Link labels (Geographic Editor toolbar)
This button controls whether the names of links are shown in the Geographic Editor.
Current zoom (Geographic Editor grid toolbar)
Displays the zoom.
Zoom in (Geographic Editor grid toolbar)
This button allows you to zoom into the model in the Geographic Editor.
Zoom out (Geographic Editor grid toolbar)
This button allows you to zoom out of the model in the Geographic Editor.
Fit to window (Geographic Editor grid toolbar)
This button fits the entire model horizontally and vertically in the Geographic Editor window. This ensures that all components of the model are visible in the window.
Figure 13. Graph tab toolbar
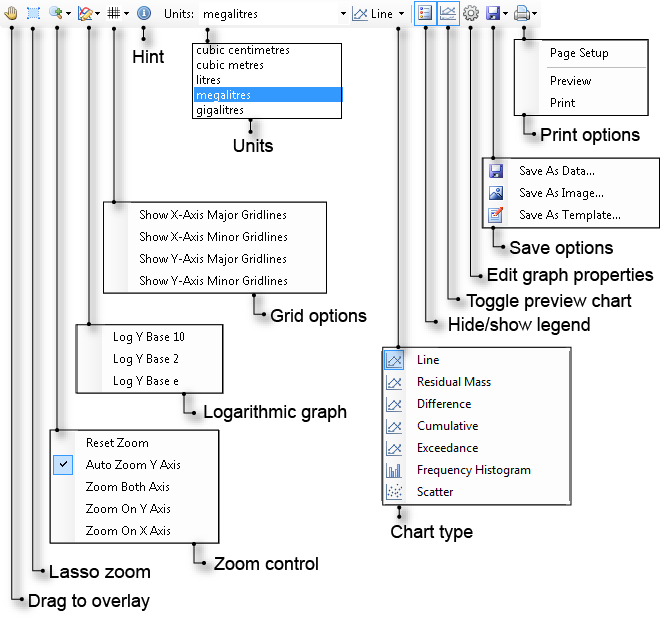
The buttons and pop-up menus accessible from the Graph tab toolbar are explained in more detail in the chapter on Using the Charting Tool. See Graph viewing options.
Drag to overlay
Used to overlay one graph onto another.
Lasso Zoom
Enables zooming (when used in conjunction with Zoom Control).
Zoom Control
A pop-up menu affecting zooming behaviour (when used in conjunction with Lasso Zoom).
Logarithmic graph
Recomputes the Y-axis of the graph for different logarithmic scales.
Grid Options
A pop-up menu affecting the behaviour of grid lines.
Hint
Toggles display for the x and y coordinates of the tracing points.
Units
A pop-up menu allowing you to recompute the Y-axis using different units.
Chart type
A pop-up menu which allows you to obtain alternative views of multiple data sets as well as recompute the chart as probability distributions.
Hide/show legend
Toggles display of the legend.
Toggle preview chart
Toggles display of the preview chart.
Edit graph properties
Opens a panel where chart settings (eg. colours) can be adjusted.
Save options
A pop-up menu offering a number of ways in which data can be exported from the Charting Tool.
Print options
A pop-up menu providing access to printing tools.
Figure 14. Layer Manager toolbar
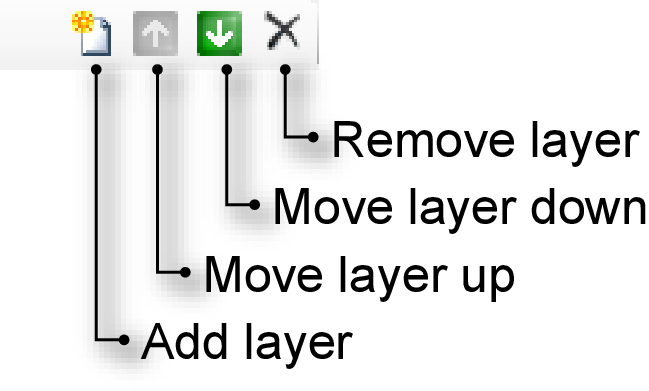
Add layer
Allows the addition of a new layer to the geographic view.
Move layer up
Moves the layer selected in the Layer Manager higher up in the layer appearance order.
Move layer down
Moves the layer selected in the Layer Manager lower down in the layer appearance order.
Remove Layer
Removes the layer currently selected in the Layer Manager from the geographic view.
Figure 15. Ordering toolbar
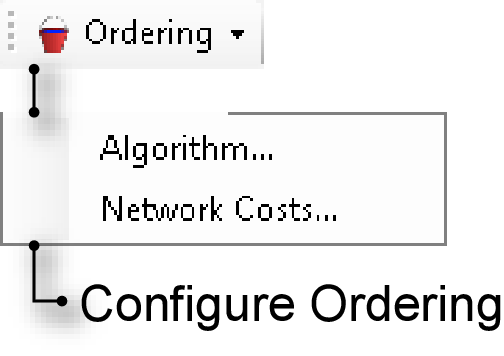
Configure Ordering
A pop-up menu with two options:
- Algorithm... opens the Configure Ordering Algorithm modal dialog. Synonym for
- Network Costs... opens the Cost Functions modal dialog. Synonym for Edit
Figure 16. Project toolbar
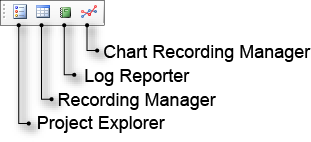
Project Explorer
Toggles whether the Project Explorer is visible on screen. Synonym for .
Recording Manager
Toggles whether the Recording Manager is visible on screen. Synonym for .
Log Reporter
Toggles whether the Log Reporter is visible on screen. Synonym for .
Chart Recording Manager
Toggles whether the Chart Recorder is visible on screen. Synonym for .
Figure 17. Project Explorer toolbar
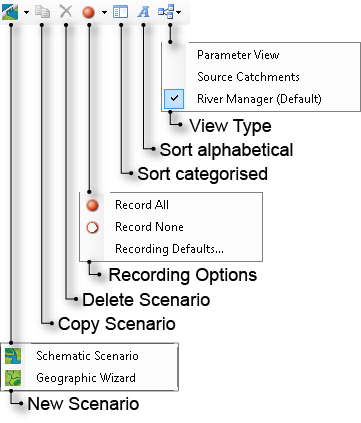
New Scenario (by menu)
Attaches a new, empty scenario to the current project. Synonym for both and New Scenario on the File toolbar. The available scenario options are:
- River Manager Schematic Scenario - a blank management scenario with no predefined elements; and
- Geographic Wizard - creates a scenario based on choices made through a wizard containing predefined elements.
Copy Scenario
Makes a copy of (clones) the scenario that is selected in the Project Hierarchy. You are prompted to select a new name for the copied scenario. The new scenario will be a duplicate of the original at the time of the copy. All scenario names must be unique.
Delete Scenario
Removes the scenario that is selected in the Project Hierarchy. You are prompted to confirm the deletion. Deletions cannot be undone.
Recording Options
Allows you to change the state of all recordable parameters for the object that is selected in the Project Hierarchy. The choice will be applied to the selected element and all elements below it in the hierarchy. The choices are:
- Record All - records all of the parameters under this level of the hierarchy when the model is run. The recorded results will be visible in the Recording Manager window. See Running scenarios;
- Record None - records none of the parameters under this level of the hierarchy when the model is run; and
- The Recording Defaults... option opens the Set Recording Defaults dialog where you can define a set of recording options that will be applied to all of your Source projects by default.
Sort Categorised
Sorts the components of each scenario according to the type of component (eg. all links sort together, all nodes sort together, etc) and, within each component grouping, according to component sub-type (eg. all Inflow nodes sort together).
Sort Alphabetical
Sorts the components of each scenario into alphabetical order according to the names of the components in your scenario.
View Type
This pop-up menu offers three choices:
- Parameter View which changes the Project Hierarchy so that it is classified according to the kind of recordable parameter;
- Source Catchments view, which is not relevant to Source; and
- River Manager (Default) view which changes the Project Hierarchy so that it is classified according to the kind of recordable component.
Figure 18. Recording Manager toolbar (Scenario results)
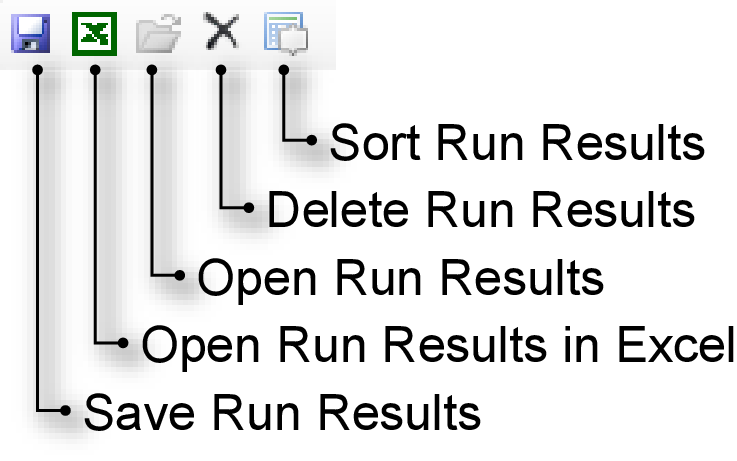
Save Run Results
Exports time-series data from the currently-selected run to either a .CSV or tab-separated-value file.
Open Run Results in Excel
Exports the collected results data to Excel as a single time-aligned spreadsheet. The left-most column of the spreadsheet contains a time-stamp. Each of the remaining columns contains observations from one of your recordable parameters, in the same order as the results appear in the Recording Manager.
Open Run Results
Not enabled.
Delete Run Results
Clears the currently selected run. You are not prompted to confirm the action and it can not be undone.
Sort Run Results
This button lists the run results based on the network run order – leaf nodes to outlet node. Note that this is the default order of run results. It can be used to reset the results after other sorting methods (such as column headings) have been used.
Figure 19. Scenario toolbar (part of the Main screen)
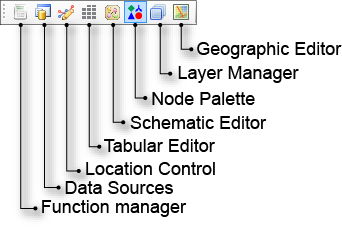
Function manager
Toggles the state of the Function manager dockable window. Synonym for View Function manager.
Data Sources
Toggles the state of the Data Sources dockable window. Synonym for View Data Sources.
Location Control
Toggles the state of the Location Control dockable window. Synonym for View Location Control.
Tabular Editor
Toggles the state of the Tabular Editor tab. Synonym for View Tabular Editor.
Schematic Editor
Toggles the state of the Schematic Editor tab. Synonym for View Schematic Editor.
Node Palette
Toggles the state of the Node Palette. Synonym for View Node Palette.
Layer Manager
Toggles the state of the Layer Manager window. Synonym for View Layer Manager.
Geographic Editor
Toggles the state of the Geographic View tab. Synonym for .
Figure 20. Schematic Editor grid toolbar (Schematic Editor)
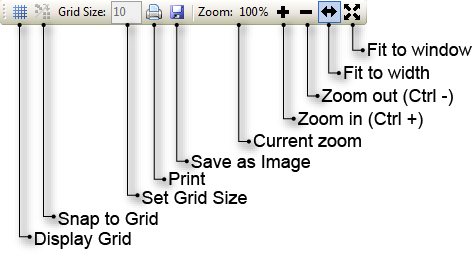
Display Grid
Controls whether the Schematic Editor displays a grid on the drawing canvas.
Snap to Grid
Controls whether nodes are aligned with the underlying grid in the Schematic Editor.
Set Grid Size
The value in this field determines the frequency of grid lines in the Schematic Editor. The units are in pixels.
Print (Schematic Editor grid toolbar)
Formats the Schematic Editor for printing and opens the Print preview dialog.
Save as Image (Schematic Editor grid toolbar)
Prepares the Schematic Editor for saving in JPEG format.
Current zoom (Schematic Editor grid toolbar)
Displays the zoom.
Zoom in (Schematic Editor grid toolbar)
This button allows you to zoom into the model in the Schematic Editor.
Zoom out (Schematic Editor grid toolbar)
This button allows you to zoom out of the model in the Schematic Editor.
Fit to width (Schematic Editor grid toolbar)
This button fits the entire model horizontally in the Schematic Editor window.
Fit to window (Schematic Editor grid toolbar)
This button fits the entire model both horizontally and vertically in the Schematic Editor window. This ensures that all components of the model are visible in the window.
Figure 21. Schematic Editor options toolbar (Schematic Editor)
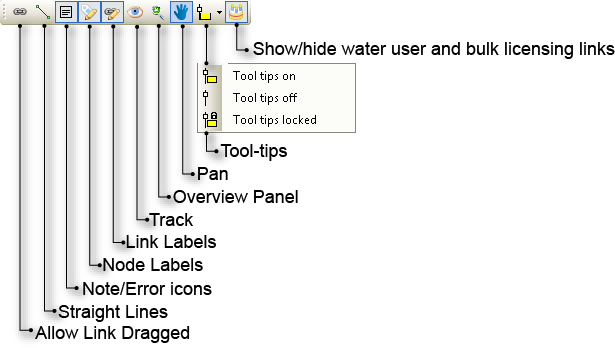
Allow Link Dragged
Enabling this button allows you to disconnect the downstream end of a link from the node to which it is attached, and then re-connect that link to the upstream inlet of another node. You can use this feature to insert new nodes into a schematic without losing the configuration of existing links.
Straight Lines
This button controls the representation of links. Source defaults to drawing links using orthogonal (elbow) lines. Click Straight Lines to change the default representation to straight lines.
The representation of any link can be controlled independently using the contextual menu in the Schematic Editor. Right-click the link and choose one of the options in the Link Type sub-menu.
Each line has one control point which you can adjust to route the line around obstacles. The control point for an orthogonal line can only be moved in the vertical dimension whereas the control point for a straight line has no restrictions on its movement.
Note/Error icons
This button toggles view of any notes and/or errors that are present in the Schematic Editor.
Node Labels
This button controls whether the names of nodes are shown in the Schematic Editor. Source defaults to displaying node names.
Link Labels
This button controls whether the names of links are shown in the Schematic Editor. Source defaults to displaying link names.
Track (Schematic Editor options toolbar)
This button controls whether the Schematic Editor always scrolls to show components as they are selected in the Project Hierarchy. The default state of this button is off. In this mode, Source leaves the Schematic Editor window unchanged, regardless of any selections you may make in the Project Hierarchy.
If you turn Track on, the Schematic Editor window will scroll to bring into view any node or link that you select in the Project Hierarchy. You can use this feature to locate components in large models.
Overview Panel
This button controls whether the Overview Panel is shown in the Schematic Editor. The default state of this control is off. You can use the Overview Panel to obtain a thumbnail view of your entire schematic.
Pan
When this button is enabled, clicking and holding on any part of the drawing surface in the Schematic Editor moves the entire drawing surface. This is an alternative to using the scroll bars.
Tool-tips
This button is a popup menu containing three options:
- Tool tips on - when selected, clicking on any node in the Schematic Editor causes a small floating window to appear which contains additional information about that node.
- Tool tips off - when selected, the floating windows do not appear.
- Tool tips locked - when selected, clicking any node in the Schematic Editor causes a small floating window to appear next to every node.
Show/hide water user and bulk licensing nodes
Toggles view of links that enter and exit the water user and bulk licensing nodes.
Figure 22. Statistics toolbar (Statistics tab)
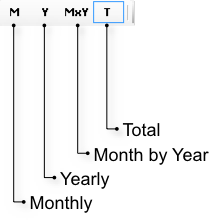
Monthly
Shows the statistics for each month of the year in the period run.
Yearly
Shows the statistics for each year in the period run.
Month by Year
Shows the individual statistics for every month of every year in the period run.
Total
Provides statistical data for the entire period run.
Refer to Using the Charting Tool for more detail on these commands.