Note: This is documentation for version 4.3 of Source. For a different version of Source, select the relevant space by using the Spaces menu in the toolbar above
Specifying data inputs
- teamcity (Deactivated)
- Darryl Lindner (Deactivated)
This section describes how to load time series data into Source and how to manually enter data in to tables. Additional sub-pages include:
Scenario Input Sets allow you to easily keep model structure, while switching between groups of input data and parameters.
Time series data
There are two types of time series data inputs:
- File – a text-based time series data file in a supported file format. Refer to Loading a file data source.
- Scenario – the results of a run from a different scenario can be used as an input for the current scenario. Refer to Loading a scenario data source.
When time series data is loaded in to Source, it is referred to as a data source and is available throughout Source. To either load new data sources, or access previously loaded data sources, you can use:
- the Data Sources Explorer
- the Data Source option in a component's feature editor (Figure 1)
- the Feature Table
- the /wiki/spaces/SD43/pages/53543859
- the Command Line Runner Options
- the output of the Climate data import tool
Figure 1. Loading a data source from within a component's feature editor

Data Sources Explorer
Source allows you to load and manage time series data at a central location using the Data Sources Explorer (Figure 2). Note that all data sources for the active scenario appear in the Explorer regardless of whether they were loaded using the Explorer, or one of the other methods listed above (eg. by using a component's feature editor, Figure 1).
Figure 2 shows features of the Data Sources Explorer containing all data sources available in the scenario, both from time series data files and another scenario. Additionally, the nodes that some of the data sources are associated with are shown. Once a time series has been assigned to a node it is locked to that node, as indicated by the padlock.
Figure 2. Data Sources Explorer
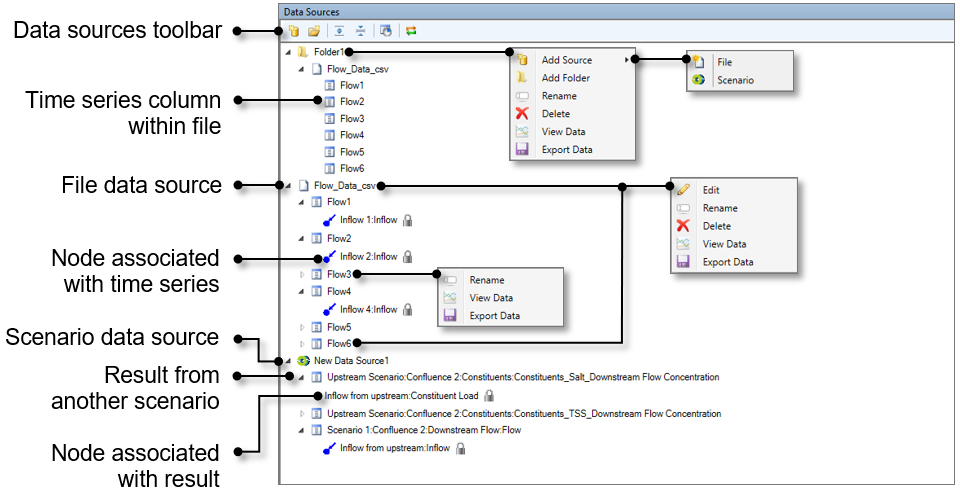
The contextual menu options allow you to:
- Add Source to add a new file or scenario data source;
- Add Folder to create a new folder;
- Delete the selected file/folder;
- Edit the selected data source. This opens the Load Data Source dialog (shown in Figures 3 and 4) where you can change various features of the data source;
- Export data to a .csv file;
- Rename the input data file/folder; and
- View Data in the charting tool
Figure 3. Data Sources toolbar
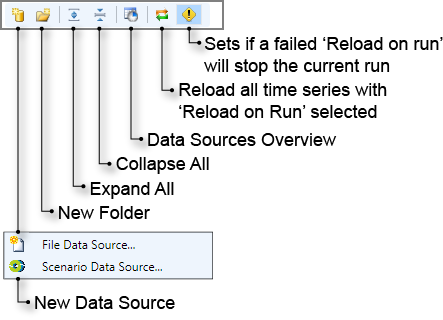
The Data Sources toolbar (Figure 3) has the following functions:
- New Data Source creates a new data source, using either the output of a scenario (Scenario Data Source...) or a time-series file (File Data Source...);
- New Folder creates a new folder, allowing organisation of data sources;
- Expand All expands the file hierarchy;
- Collapse All collapses the file hierarchy;
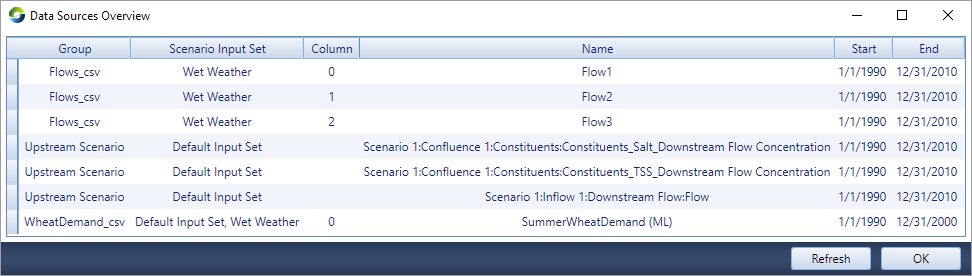
- Data Sources Overview opens the Data Sources Overview window, displaying metadata for all file and scenario data sources in the active scenario (Figure 3). This is particularly useful for checking the start and end dates of your data. For example, in Figure 3, WheatDemand_csv has an end date a decade before all other data sources;
- Reload all time series with 'Reload on Run' reloads all time series when Reload on Run is also selected from within the Load Data Source dialog (Figures 4 and 5); and
- Sets if a failed 'Reload on Run will stop the current run works in conjunction with Reload on Run to determine if source data will cause a scenario run failure. It is shown toggled on in Figures 2 and 3.
Figure 3. Data Sources Overview
Loading a file data source
To load a time series data file, either:
- Click the New Data Source button on the Data Sources toolbar and choose File Data Source... from the drop down menu; or
- Right-click on a Folder and choose Add Source File from the contextual menu.
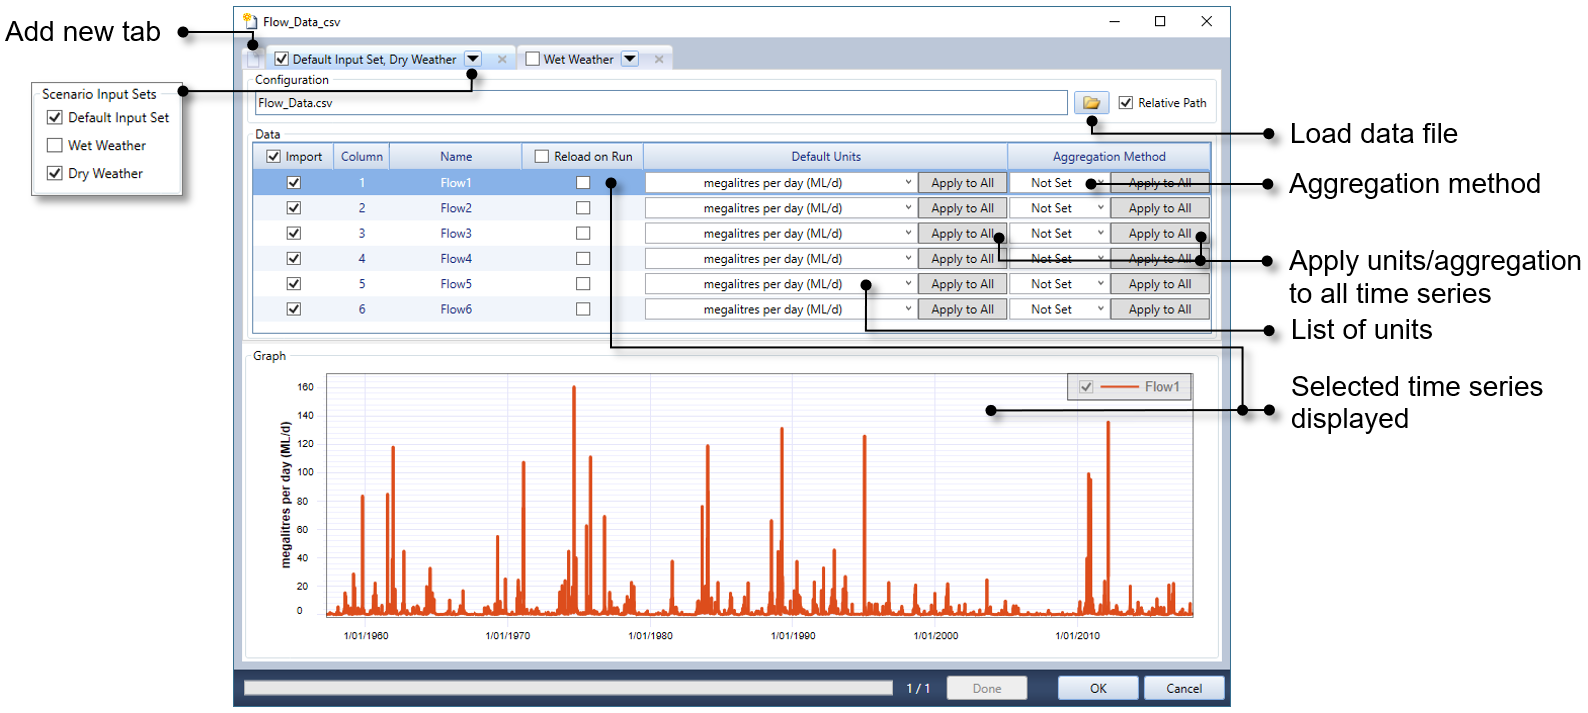
The Load File Data Source dialog opens (Figure 5). Then, follow these steps:
- Click the Load data file button and navigate to and select your time series data file.
The path to you data file is displayed. If you enable the Relative Path check box, the path displayed is the location of the time-series file relative to the project. Note that the project must have been saved prior to this.
- Each column of data in the time series data file becomes a row in the Data table. All time series data in the file is imported by default. You can select what columns to import by toggling the appropriate check box in the Import column.
- Choose the scenario input set(s) associated with this data source by clicking on the arrow for the Default Input Set tab and toggling the appropriate check boxes. Refer to Assigning data sources to scenario input sets for more detail.
- Click on Reload on Run to toggle whether Source reloads the data into the internal store when the Scenario is next run (for more information, see below).
- Click on a Default Units cell and choose the appropriate units from the drop down menu. Right-click on a Default Units cell to bring up a contextual menu that allows you to Apply Unit to all data.
Once a file data source has been loaded, it will be listed in the Data Source Explorer. Its default name is that of the associated file, with "." replaced with "_". Grouped underneath each data source are the time series columns you have selected to import from that file, with the names taken from the column headings in the file (if there are no column headings, Source will name them Column01, Column02, …). The data source and time series can be renamed by right clicking on the item and selecting Rename from the contextual menu. Like functions and variables, each data source must have a unique full name. Two data sources can have a non-unique name if they are in different folders, because the full path to the data source is still unique (eg. Flows_csv in Figure 2).
Once you assign a time series to a node or link, the associated component is shown underneath that time series (Figure 2). To disconnect a time series from a component, open the required feature editor. In the Data Source option, click on the data source that contains the associated time series. The time series will be removed from the node. This can be confirmed by checking the Data Sources Explorer.
Figure 5. Load File Data Source
Loading a scenario data source
You can only load the result(s) of scenario run(s). Therefore, ensure that the donor scenario has been run before you load the scenario data source into the acceptor scenario.
To load the results of a scenario, either:
- Click the New Data Source button on the Data Sources toolbar and choose Scenario Data Source... from the drop down menu; or
- Right-click on a Folder and choose Add Source Scenario from the contextual menu.
This opens the Load Scenario Data Source dialog (Figure 6). Then:
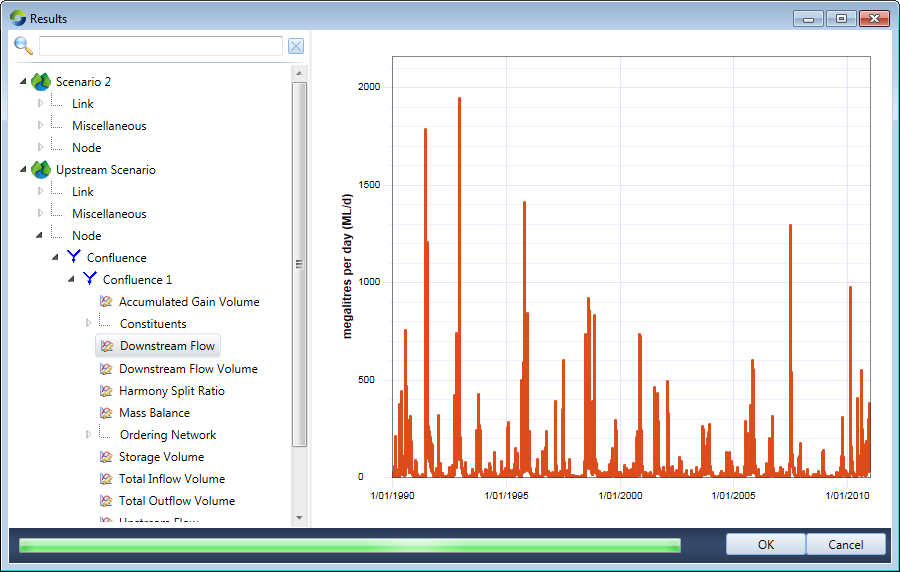
- Click on the ellipsis (…) button on the first column of the Data table, which opens the Results dialog (Figure 7).
- This dialog lists the most recent results for each scenario that you have run in your project. Choose the result that you wish to use as input data to your current scenario. In Figure 7, this data is Upstream Scenario Confluence 1's Downstream Flow;
- Click OK to close the Results dialog.
- If required, enable the Reload on Run checkbox (see below).
- The units are set automatically from the result chosen.
- Just as with time series, you can select the scenario input set(s) associated with this data source.
- To load another scenario data source, repeat this process.
Once a scenario data source has been loaded, it will be listed in the Data Source Explorer. Its default name is New Group1. Grouped underneath the scenario data source are the results you selected to import from the donor scenario(s). The data source and time series can be renamed by right-clicking on the item and selecting Rename from the contextual menu.
Once you assign a time series to a node or link, the associated component is shown underneath that time series (Figure 2). A time series can be disconnected from a component.
Figure 6. Load Scenario Data Source
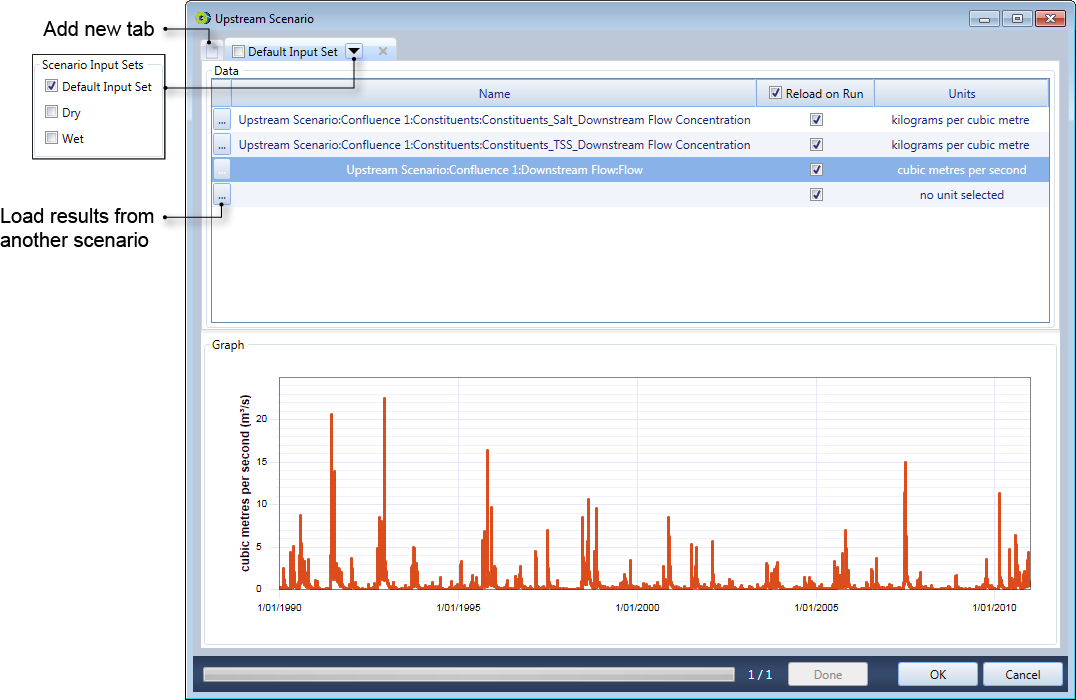
Figure 7. New Data Source, Results
Editing data sources
You can edit a data source after it has been imported to modify the options you selected during loading, eg. the associated scenario input set(s). In the Data Sources Explorer, right-click on the data source you wish to change, and choose Edit from the contextual menu, and the appropriate Load Data Source dialog (Figures 5, 6) will re-open.
Reload on Run
In many cases, there is a Reload on Run checkbox associated with the controls for loading data into Source. Regardless of whether the data source is a file or another scenario, when you first load a data source, it is loaded into an internal store.
When Reload on Run is enabled, Source will reload its internal store from the original source file each time you click the Run button. Therefore, for every run, your data sources must be accessible, that is:
- For File Data Sources, the source file cannot be open in another program; and the file must be located at the file path specified when you loaded your data. If Relative Path is also enabled, the data sources needs to be accessible at the same file path relative to your project.
- For Scenario Data Sources, the donor scenario must be run before running the acceptor scenario.
Assigning data sources to scenario input sets
Scenario input sets allow you to easily switch between groups of input data and parameters that represent different conditions, such as normal, wet and dry (see Scenario Input Sets for more information). Data sources are assigned to specific scenario input set(s) using the Load Data Source dialogs (Figures 5, 6).
Each scenario has a Default Input Set created automatically when you create the scenario, and by default all loaded data sources will be assigned to this root-level scenario input set. To create another root-level scenario input set, see Adding Scenario Input Sets. It is also possible to create a child scenario input set, which inherits all parameters and data sources specified in its parent. However, data sources can only be assigned to root-level scenario input sets.
Once configured, a file data source may group several time series data files together; up to one file per scenario input set. Assign a file data source to root-level scenario input set(s) as follows:
- Open the Load file data source dialog (Figure 5) either by creating a new data source or editing an existing one (see Loading a file data source for more information).
- The first time series data file you load is associated with all scenario input sets that exist when it is loaded.
- For each additional time series data file you want to add to the data source:
- Create a new tab by clicking the Add New Tab button. By default new tabs are not associated with any scenario input sets.
Load the time series data file (see Loading a file data source for more information)
- Choose the scenario input set(s) to associate with each time series data file by selecting the tab's drop-down menu and toggling the check box next to the appropriate scenario input set(s). The associated scenario input sets are listed in the tab's heading. For example, in Figure 5, Flows.csv is associated with Default Input Set and Dry Weather. Source will warn you if you assign more than one time series data file to the same scenario input set.
- The check box next to the tab name determines which time series data file Source will use to name the time series columns; only one of the tabs can be toggled on. If none of the check boxes are selected, the column names from the file in the first tab will be used.
The default name of the data source will be the file name in the first tab. Both the data source and the time series columns can be renamed in the Data Source Explorer (see above).
Assign a scenario data source to scenario input set(s) as explained for a file data sources, but use a new tab for each input scenario.
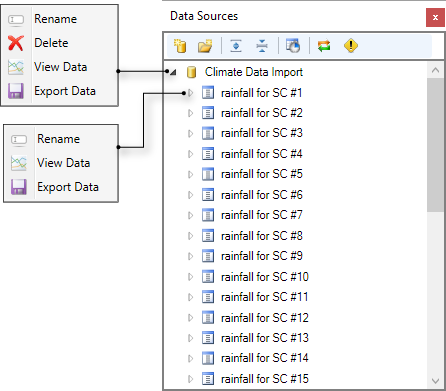
Data from Climate data import tool
Once data is generated using the Climate data import tool, it can be used as a data source in the Data Sources Explorer, as shown in Figure 8.
Figure 8. Data Source Explorer, Climate Data Import
Manual data entry in tables
Some Source windows allow you to manually enter data into tables and view a graphical representation alongside. This holds for most tables across Source.
Follow the steps shown in Figure 9 to enter data into the table, one row at a time.
Additional shortcuts for entering data include:
- Press the tab button to move across the columns, then down to the next row. This button maintains the 'Edit status' of a cell;
- Pressing F2 is synonymous to using the Enter key - they both enter or exit the Edit status;
- Press the Delete key to remove a row; and
- As you enter data points in the table, the graph on the right will get populated.
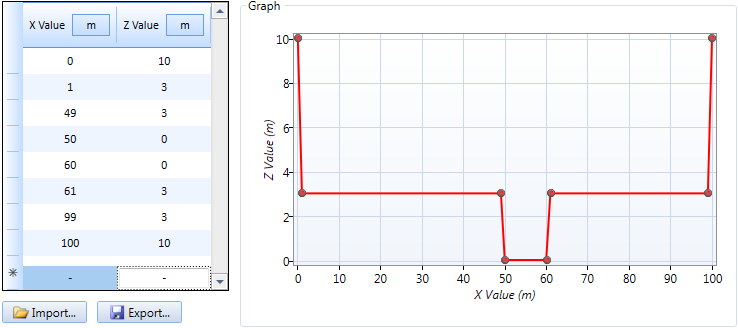
An example of a completed table is shown in Figure 10.
Figure 9. Steps to manually enter data tables
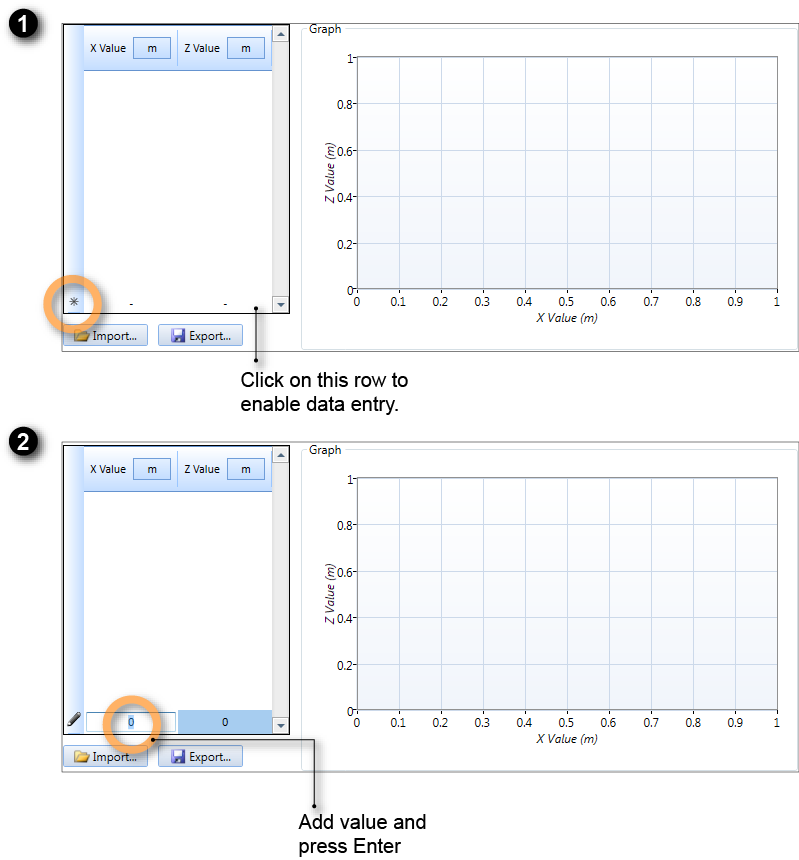
Figure 10. Manual data entry in tables (completed)