Note: This is documentation for version 4.11 of Source. For a different version of Source, select the relevant space by using the Spaces menu in the toolbar above
Running scenarios
Introduction
A Source scenario must be run in order to produce any useful information. Each scenario run produces a collection of result sets. A result set is a group of related outputs, usually from the same component and is usually, but not always, arranged as a time series.
During a run, each component in the scenario can produce one or more result sets in the form of predicted water flows, volumes and other outputs specific to that component. Some components are capable of producing more than 20 separate result sets. When ownership is not enabled, the model starts at the first node then progresses down the river system in a single pass to compute the water volume and flow rates through each node and link.
Recording parameters
When you run a scenario, every node and link produce results in the form of predicted water flows, volumes and other data outputs. To view or save these model outputs after the run, you need to select them to record before you run. When you save a project or make a copy of a scenario, Source automatically saves the list of model outputs selected for recording. There are two ways to select which parameters and model elements to record, using the Project Hierarchy to select model parameters at the component level (eg. links, nodes), or more fine-grained parameter-level control in the Parameter pane.
Component-level controls
For a given scenario run, you can select which outputs will be recorded using the component's contextual menu or the Record icon in the Project Explorer toolbar:
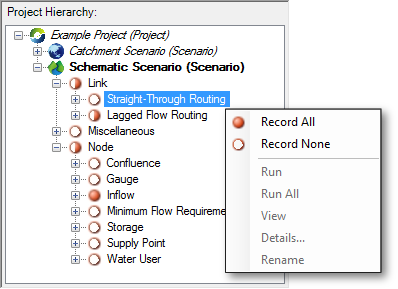
- Using the Project Explorer, right-click a group or individual model element (eg. node, link, function or other element) in the Project Hierarchy (Figure 6). From the contextual menu, select:
- Record All – every parameter at this level and below will be recorded;
- Record None – no parameters at this level and below will be recorded;
If the indicator appears as , some (not all) parameters at this level and below will be recorded.
- If you select a component on the Geographic Editor or Schematic Editor (eg a catchment outlet), then the chosen component is highlighted in the Project Hierarchy. Right-click the component's name and select the recording status from the contextual menu, or click the Record icon in the Project Explorer toolbar.
- By clicking button above Project Explorer, this will display the long description area under Parameter window. To get a long description to appear in the long description area, a recorder must be selected in the Parameter window. Hovering over a recorder in the Parameter window will present the long description if there is one.
Figure 6. Selecting recording parameters
Parameter-level controls
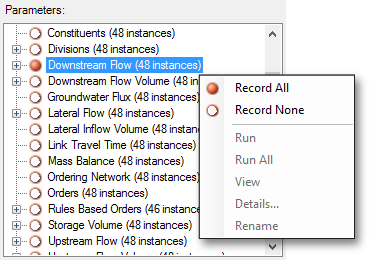
For fine-grained control of individual recordable parameters (Figure 7):
- Select the group or model element within the Project Hierarchy. Selection causes all of the group's or element’s parameters to be displayed in the Parameters area; and
- Use the contextual menu to enable or disable individual parameters or parameter groups.
Figure 7. Selecting model parameters
Using the Log Reporter
If a scenario run results in errors or warnings, the first indication of those is displayed in the Run completion dialogue by a red or yellow icon next to the Close button as indicated in Figure 7.
Figure 7. Running scenario (error)
You can investigate the causes of errors or warnings using the Log reporter (Figure 8). If the Log Reporter window is not visible, do either or both of the following:
- Choose to make it visible; and/or
- Make the Log Reporter active by clicking the Log Reporter tab.
Once the Log Reporter is active, you can view all the logs run by Source, from configuring a scenario to running it. You can clear the log or export its contents to a .csv file using the contextual menu (as shown in Figure 8). Table 1 provides a description of each of the columns in the Log Reporter.
Figure 8. Log Reporter
Table 1. Log Reporter, Columns
| Column | Description |
|---|---|
| Date | The local date on the computer. |
| Run | The run number. You can also filter messages based on this number - use the filtering icon. |
| Level | The notification level associated with the message, which can be one of information, warning, error or fatal. The messages are classified according to the way in which they were generated (see Message Type). |
| Time Step | The scenario time-step which the message refers to. |
| Name | Name of the node or link corresponding to the message. |
| Model Type | These are the node and link types – ie. Inflow, Straight Through Routing |
| Message | Details of the message. |
| Message Type | There are three types available:
|
Execution order rules
During a scenario run, components of the scenario are run in a particular order to ensure that they comply with inbuilt Simulation phases and execution order rules.
Execution order rules are now available in Scenario Options: Execution Order Rules
Scenario results
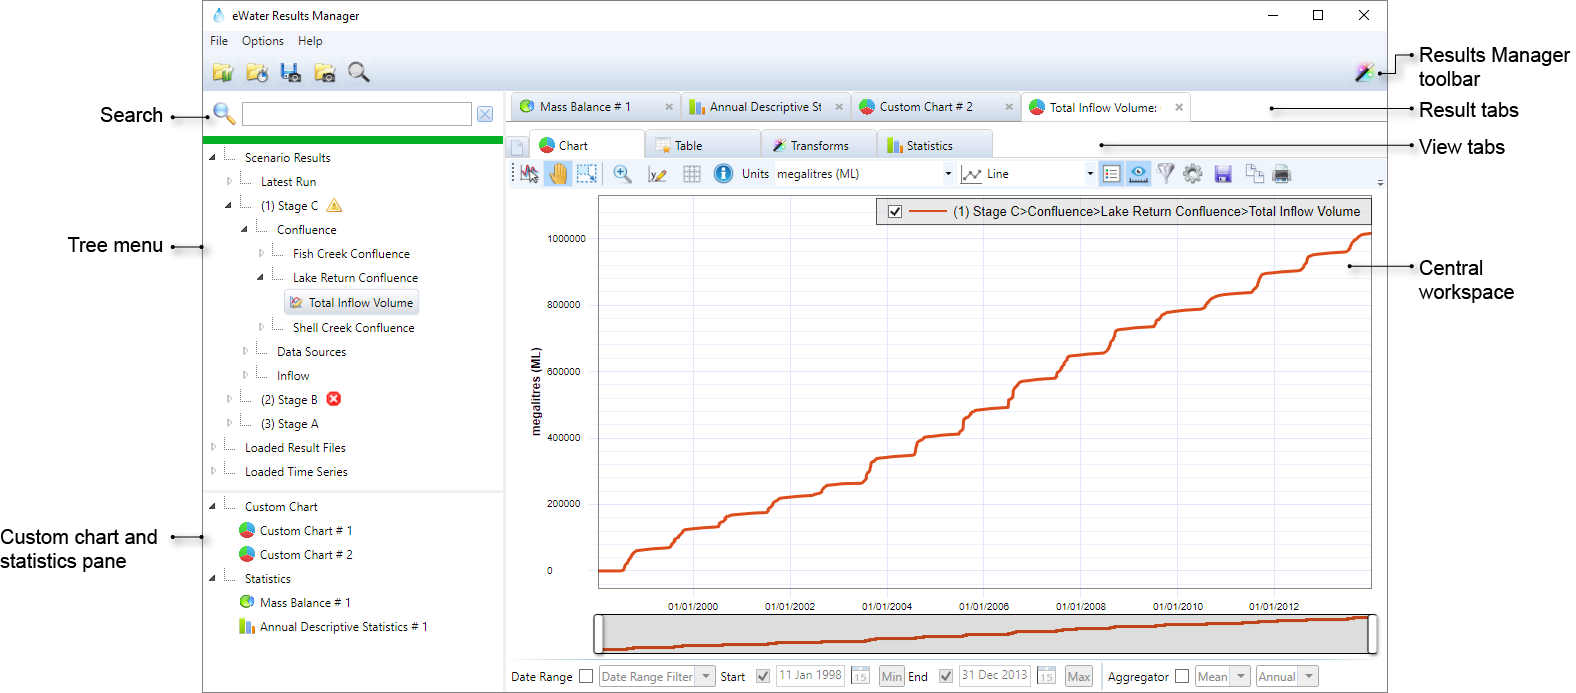
Once run, every scenario generates a result set – a distinct collection of results recorded for that run. Scenario results can be examined and analysed using the Results Manager, which opens when a run completes. Within Results Manager, results can be evaluated graphically in charts, numerically in tables or as statistics, and they can also be filtered and manipulated using transforms. With custom charts, you can also view and statistically analyse multiple results within and between runs, compare results to external data sources and automatically update with the latest results each time a model is run. See Results Manager for more information.
In Results Manager, result sets are listed in the tree menu on the left side. The name of scenario's result set is formed by concatenating the run number from the current session with the name of the scenario. If there are errors or warnings from your run, these are indicated by an appropriate symbol next to the result set's name (see notification level), and are also listed in the Log Reporter (see Using the Log Reporter). For example, Figure 11 shows that in this Source session, Stage C was run first, and had warning(s) associated with it, Stage B was run next and had a fatal error that stopped the run from completing, and Stage A was run third without any warnings or errors.


