Meteorological Data
Creation of a MUSIC Catchment file requires an associated meteorological data file. This can be obtained in one of three ways:
- Using one of templates provided;
- Import your own meteorological data (rainfall and evapotranspiration), and create a template with it, so that you can base your catchment file on this user-created template. You can import either ASCII files or meteorology agencies Rainfall Data formatted files by using the New menu entry in the music tab; or
- Use the command line. Contact eWater for more information.
Using the available templates
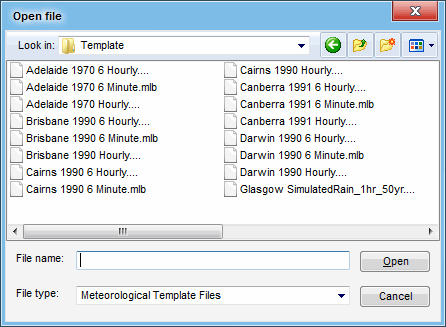
When you create a new Catchment file (File » New), you are presented with a dialogue box which prompts you to choose a meteorological data template to build the Catchment file from. You are presented with a choice of templates (from the Templates folder), differing in their location, time-step and duration.
Simply select an appropriate meteorological data template and click ‘Open’ (refer to Selecting an Appropriate Timestep for guidance).
Importing ASCII files
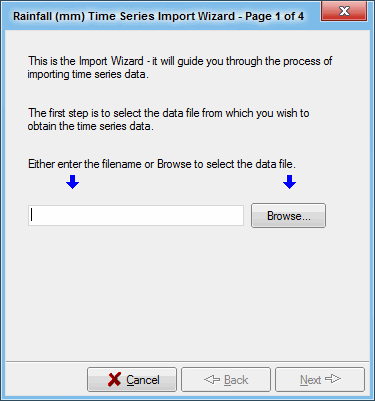
If you choose Import ASCII file you will be presented with a step-by-step wizard which guides you through the import process:
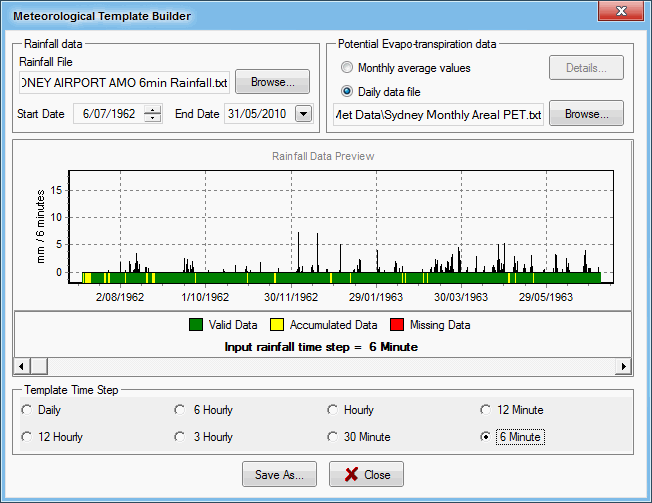
The four-step Rainfall time-series wizard will guide you through the rainfall data import. The wizard will ask you (Page 1) to select the data file from which you wish to create the template, then (Page 2) allow you to strip header rows, select the appropriate column and format (e.g. tab or space-delimited) (Page 3), and finally select the starting date and time-step (Page 4).
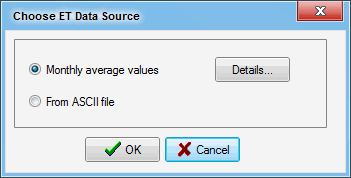
Having imported the rainfall time series, you are then given a choice for providing evapotranspiration data:
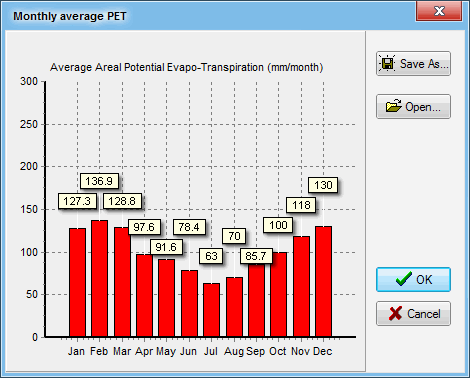
If you choose ‘Monthly average values’, you are presented with a dialogue box which allows you to edit monthly average values for areal potential evapotranspiration, in mm per month.
If you wish to use an ASCII file that contains daily evapotranspiration data, you will be assisted in importing this data, using an import-wizard.
The three-step Evapotranspiration time-series wizard will ask you (Page 1) to select the data file, strip header rows (Page 2), and select the appropriate column.
From here, you will be prompted to save the new Meteorological Template file that you have created. This file can now be used to build a new catchment file in MUSIC.
Importing Rainfall / Evapotranspiration Files
The MUSIC Meteorological Template Builder supports a range of rainfall input file formats. This includes.
- BOM 6 Minute Rainfall File (.TXT)
- Hydrolog (.DTF)
- Tarsier Daily Timeseries (.TTS)
- CDT comma separated (.CDT)
- CSV comma separated (.CSV)
- WISKI ALL (.ALL)
- WISKI CSV (.CSV)
- Met Office CSV (.CSV)
Detailed information on each of the file formats is provided below.
Note: MUSIC requires daily or monthly potential evapotranspiration data. The files supplied with MUSIC are monthly potential evapotranspiration data. Data provided by meteorology agencies may be daily evaporation data, rather than potential evapotranspiration. To convert evaporation data into evapotranspiration data:
- Obtain long-term statistics for monthly evaporation (available from meteorology agencies) at the site of interest.
- Compare the monthly evaporation from meteorology agencies and monthly areal potential evapotranspiration (e.g. from the Climatic Atlas of Australia - Evapotranspiration (Wang et al., 2001)).
- From this, calculate a conversion factor, and apply this conversion factor to the evaporation data.
- Import this converted dataset into MUSIC.
Alternatively, methods exist to take several climatic factors such as temperature, wind speed and relative humidity to derive PET, though this data may not always be available.
Supported Rainfall File Formats
The following provides a summary of the rainfall file formats that are supported by MUSIC.
BoM 6 minute Rainfall File (*.txt)
A fixed format file type, typically supplied by the Australian Bureau of Meteorology foe 6 minute pluviograph data. The file contains two header lines:
- Line 1 contains the station identified and an integer (1);
- Line 2 contains the station number and name.
Data lines start with the station number, followed by date (yyyymmdd), then 240 values of 6 minute data for that day. All values are on a fixed spacing. A sample file is provided below:
9741 1 9741 2 ALBANY AIRPORT 9741 1965 1 1-9999.0-9999.0-9999.0-9999.0-9999.0-9999.0-9999.0-9999.0-9999.0-9999.0-9999.0-9999.0-9999.0-9999.0-9999.0-9999.0-9999.0-9999.0-9999.0-9999.0-9999.0-9999 9741 1965 1 2-9999.0-9999.0-9999.0-9999.0-9999.0-9999.0-9999.0-9999.0-9999.0-9999.0-9999.0-9999.0-9999.0-9999.0-9999.0-9999.0-9999.0-9999.0-9999.0-9999.0-9999.0-9999 9741 1965 1 2-9999.0-9999.0-9999.0-9999.0-9999.0-9999.0-9999.0-9999.0-9999.0-9999.0-9999.0-9999.0-9999.0-9999.0-9999.0-9999.0-9999.0-9999.0-9999.0-9999.0-9999.0-9999 9741 1965 1 3-9999.0-9999.0-9999.0-9999.0-9999.0-9999.0-9999.0-9999.0-9999.0-9999.0-9999.0-9999.0-9999.0-9999.0-9999.0-9999.0-9999.0-9999.0-9999.0-9999.0-9999.0-9999 9741 1965 1 4-9999.0-9999.0-9999.0-9999.0-9999.0-9999.0-9999.0-9999.0-9999.0-9999.0-9999.0-9999.0-9999.0-9999.0-9999.0-9999.0-9999.0-9999.0-9999.0-9999.0-9999.0-9999 9741 1965 1 5-9999.0-9999.0-9999.0-9999.0-9999.0-9999.0-9999.0-9999.0-9999.0-9999.0-9999.0-9999.0-9999.0-9999.0-9999.0-9999.0-9999.0-9999.0-9999.0-9999.0-9999.0-9999 .... 9741 1965 413 0.0 0.0 0.0 0.0 0.0 0.0 0.0 0.0 0.0 0.0 0.0 0.0 0.0 0.0 0.0 1.1 1.2 0.0 0.0 0.0 0.0 9741 1965 414-8888.0-8888.0-8888.0-8888.0-8888.0-8888.0-8888.0-8888.0-8888.0-8888.0-8888.0-8888.0-8888.0-8888.0-8888.0-8888.0-8888.0-8888.0-8888.0-8888.0-8888 9741 1965 415 0.7 4.4 4.1 1.6 4.3 4.3 0.2 2.7 2.9 0.4 0.0 0.0 0.0 2.0 1.9 0.6 0.0 0.0 0.0 0.7 1.4 9741 1965 416 0.0 0.0 0.0 0.0 0.0 0.0 0.0 0.0 1.3 0.6 0.0 0.0 0.0 0.0 0.0 0.0 0.0 1.9 1.9 0.0 0.0 9741 1965 419 0.0 0.0 0.0 0.0 0.0 0.0 0.0 0.0 0.0 0.0 0.0 0.0 0.0 0.0 0.0 0.0 0.0 0.0 0.0 0.0 0.0 9741 1965 420-8888.0-8888.0-8888.0-8888.0-8888.0-8888.0-8888.0-8888.0-8888.0-8888.0-8888.0-8888.0-8888.0-8888.0-8888.0-8888.0-8888.0-8888.0-8888.0-8888.0-8888 9741 1965 421-8888.0-8888.0-8888.0-8888.0-8888.0-8888.0-8888.0-8888.0-8888.0-8888.0-8888.0-8888.0-8888.0-8888.0-8888.0-8888.0-8888.0-8888.0-8888.0-8888.0-8888 9741 1965 422 0.0 0.0 0.0 0.0 0.0 0.0 0.0 0.0 0.0 0.0 0.0 0.0 0.0 0.0 0.0 0.0 0.0 0.0 0.0 0.0 0.0 |
Hydrolog (.dtf)
A fixed format file type that is output by the Hydrolog software (software used for the storage of time series data). The file has a 15-line header followed by time series data values
Note that data stored in WIKSI can be output in a variety of different formats. Therefore, care should be taken to adhere to the file format set out below.
The lines of information contained within the header are as follows. Words in bold appear literally in the file:
LINE | PURPOSE |
|---|---|
1 | File header (e.g., Hydrolog3 File Export) |
2 | User :, followed by a user name (e.g., JohnP) |
3 | Database: , followed by the database the data was extracted from |
4 | Created on : followed by the file creation date |
5 | Date Requested : followed by the start and end date/time of the time series (e.g., 21/12/2001 09:00:00 to 30/01/2002 08:59:59) |
6 | Date Format:, followed by the date format used for the time series (e.g., dd/mm/yyyy) |
7 | Quality Codes:, followed by quality codes identifier (e.g., Hydrolog4) |
8 | Blank line |
9 | Station ID:, followed by station identification number/string |
10 | Station Name:, followed by the station name |
11 | Parameter Name:, followed by the name of the measured data type (e.g., Rainfall) |
12 | Parameter Unit:, followed by the units of measurement (e.g., mm) |
13 | Archive Type:, followed by a description of the archive type |
14 | Blank line |
15 | Header line, typically, Date/Time ,Interpolated Data,Quality Code |
After the header, the data is organised in three columns that are separated by spaces:
- Column 1: Data and time in DD/MM/YYYY HH:MM:SS format (note the single space between date and time fields);
- Column 2: Rainfall value in mm;
- Column 3: Quality code;
An example of a correctly formatted .dtf file is provided below:
Hydrolog3 File Export User : ,johnp Database : , Demo Created on 25/03/2013 10:36:32 Date Requested : 01/01/2000 to 09/04/2000 Date Format:, dd/mm/yyyy Quality Codes:, Hydrolog4 Station ID:, HL017 Station Name:.Bannockburn Bridge,, Parameter Name:,Rainfall,, Parameter Unit:,mm,, Archive Type:,Recorded Archive,, Date/Time, Interpolated Data, Quality Code 1/01/2000,0.727869398,6 2/01/2000,0.569338308,6 3/01/2000,1.934807009,6 4/01/2000,0.944831487,6 5/01/2000,3.547859312,6 6/01/2000,0.94145698,6 |
Tarsier Daily Time Series (.tts)
The Tarsier daily time series format file is an ASCII text file that contains daily time series data. The file has a 21-line header followed by daily data values.
The lines of information contained within the header are as follows. Words in bold appear literally in the file:
LINE | PURPOSE |
|---|---|
1 | The Tarsier version number header |
2 | Reference to author of Tarsier modelling framework |
3 | File path and name |
4 | Name of software used to create the file |
5 | Date and time file was created |
6 | Tarsier timer series data class (eg TTimeSeriesData) |
7 | File version number |
8 | Number of header lines (set to 1) |
9 | 1. (the number 1 followed by a period) |
10 | Number of daily data entries in the file |
11 | Xlabel is always Date/Time for time series data |
12 | Y1Label Y1 fixed field, doesn’t change |
13 | Y2Label Y2 fixed field, doesn’t change |
14 | Units followed by Data units |
15 | Format followed by format information (eg 1) |
16 | Easting followed by grid position east in metres |
17 | Northing followed by grid position north in metres |
18 | Latitude followed by the latitude of the site in decimal degrees |
19 | Longitude followed by the longitude of the site in decimal degrees |
20 | Elevation followed by the elevation of the site in metres |
21 | Header character (usually an asterisk; ASCII 42, ASCII hex 2A) |
After the header, the data is organised in four columns that are separated by spaces:
- Column 1: Year;
- Column 2: Julian day of that year;
- Column 3: Data value;
- Column 4: Data quality cod - A period/dot (ASCII value 46, ASCII hex value 2E) means that the data is ok/ present. A dash (ASCII value 45, ASCII hex value 2D) means that the data is missing.
The following provides an example of TTS file:
Tarsier modelling framework, Version 2.0. : Created by Fred Watson. : File Name : D:\music tests\create-template-data\rainfall.tts : Generated from TIME Framework : Date : 25/03/2013 11:01:18 AM : File class: TTimeSeriesData. FileVersionUnknown HeaderLines 1 1. NominalNumEntries 100 XLabel Date/Time Y1Label Y1 Y2Label Y2 Units mm.day^-1 Format 1 Easting 0.000000 Northing 0.000000 Latitude 0.000000 Longitude 0.000000 Elevation 0.000000 * 2000 1 0.727869398 . 2000 2 0.569338308 . 2000 3 1.934807009 . 2000 4 0.944831487 . 2000 5 3.547859312 . 2000 6 0.94145698 . 2000 7 1.143185809 . 2000 8 7.699653845 . 2000 9 7.944560333 . |
CDT Comma Separated (.cdt)
A comma delimited column time series format file that contains regular (periodic) time series data. The file commonly has no header line, but can support a single line header specifying “Date, Time series 1” if required.
There are two columns of data, with the first column being a date string, followed by the time series value. The date string should be specified using the ISO date-time string format (e.g. 2010-01-24 00:06). The second column contains the rainfall value. The columns are separated by a comma.
Note: We strongly recommend using zero padding when defining dates, e.g. use “01/01/1996” for 1st January 1996, not 1/1/1996.
Below is an example of a suitably formatted 6 minute CDT file:
Date,Time series 1 2000-01-01,0.727869398 2000-01-02,0.569338308 2000-01-03,1.934807009 2000-01-04,0.944831487 2000-01-05,3.547859312 |
CSV Comma Separated (.csv)
A comma separated variable file is an ASCII text file that contains regular time series data (i.e., missing periods of data cannot be accommodated). There are two columns of data, with the first column being a time-date string (e.g. 01/01/2003 12:06:00), followed by the time series value. The two values are separated by a comma and the time should be in 24-hour format.
The file may have a header line with a title for each column. The first column header is usually “Date-Time” followed by a relevant data column header (e.g. rainfall_mm).
The following is an example of a correctly formatted CSV file:
Date, Timeseries 1 2000-01-01,0.727869398 2000-01-02,0.569338308 2000-01-03,1.934807009 2000-01-04,0.944831487 2000-01-05,3.547859312 2000-01-06,0.94145698 |
WISKI All (.all) and WISKI CSV (.csv)
The WISKI ALL file is an ASCII text file that contains time series data. WISKI stands for Water Information System KISTERS and is a common format for the storage of hydrologic time series.
Note that data stored in WIKSI can be output in a variety of different formats. Therefore, care should be taken to adhere to the file format set out below.
The file has a 21-line header followed by daily data values. The lines of information contained within the header are as follows. Words in bold appear literally in the file:
LINE | PURPOSE |
|---|---|
1 | Station name, followed by a comma and then the station name (e.g., Bedford, Summerhouse Hill no 2) |
2 | Station number, followed by the station number as a string surrounded with double quotes (e.g., "174053") |
3 | External number, followed by an integer station number (e.g., 174053) |
4 | River, followed by the river name |
5 | Operator, followed by an operator description |
6 | NRG, followed by a the NGR identifier (e.g., TL) |
7 | Easting, followed by the easting (i.e., X coordinate) of the station |
8 | Northing, followed by the northing (i.e., Y coordinate) of the station |
9 | Parameter-name, followed by the data type name (e.g., Rainfall) |
10 | Parameter Type, followed by the data type code (e.g., RE) |
11 | Time series name, followed by a time series identifier (e.g., 174053.RE.15.Total) |
12 | Time series unit, followed by a unit identifier (e.g., mm) |
13 | Time level, followed by a resolution description (e.g., High-resolution) |
14 | Time series type, followed by a time series type identifier (e.g., Total) |
15 | Equidistant time series, followed by a boolean value (i.e., yes or no) |
16 | Time series value distance, followed by the time-step of the time series (e.g., 15 Minute(s)) |
17 | Time series quality, followed by a quality description (e.g., Production) |
18 | Time series measuring method, followed by a description of the measurement type (e.g., Recorder) |
19 | Period of record in file, followed by the start and end date/time of the time series (e.g., 01/08/1991 15:15:00 to 20/06/2010 00:00:00) |
20 | Quality code description, followed by a list of quality code abbreviations |
21 | Header file for time series (e.g., Date Time,RF [mm],Quality flag) |
After the header, the data is organised in three columns that are separated by comma:
- Column 1: Data and time in DD/MM/YYYY HH:MM:SS format (note the single space between date and time fields);
- Column 2: Rainfall value in mm;
- Column 3: Quality code;
An example of a WIKSI All file is provided below:
Station name,Bannockburn BridgeStation number,External number,River,---Operator, -NGR,TLEasting,"08443" Northing,"49521" Parameter-name,Rainfall Parameter Type,RE Time series name,174053.RE.15.Total Time series unit,mm Time level,High-resolution Time series type,Total Equidistant time series,yes Time series value distance,1 Day Time series quality,Production Time series measuring method,Recorder Period of record in file: 01/01/2000 to 09/04/2000 Quality code description, G = good; E = estimated; S = suspect; U = unchecked; M = missing; C = complete; I = incomplete; Ed = edited; Date Time,RF [mm], Quality flag:,value2 1/01/2000,0.727869398, G,. 2/01/2000,0.569338308, G,. 3/01/2000,1.934807009, G,. 4/01/2000,0.944831487, G,. 5/01/2000,3.547859312, G,. 6/01/2000,0.94145698, G,. 7/01/2000,1.143185809, G,. 8/01/2000,7.699653845, G,. 9/01/2000,7.944560333, G,. 10/01/2000,8.986550249, G,. |
Met Office CSV (.csv)
A comma delimited, fixed format file type. It contains a header followed by the time series data. Note that rainfall is always read from the fifth column of the file.
An example of a Met Office CSV file is provided below:
MRXSQ,DATE,PE_CON_M,AE_CON_M,SMD_CON_M,PE_RLU_M,AE_RLU_M,SMD_RLU_M 123,7-Feb-06,4,4,3.6,2.5,2.5,0.6 123,14-Feb-06,7.4,7.4,0,3.9,3.9,0 123,21-Feb-06,7.5,7.5,2.8,5.1,5,2.1 123,28-Feb-06,9.2,9.2,1.6,5.5,5.5,0.1 123,7-Mar-06,6.3,6.3,0,4.3,4.3,0 123,14-Mar-06,10.9,10.9,0,5.8,5.8,0 123,21-Mar-06,5.9,5.9,3.9,5.3,5.3,3.7 123,28-Mar-06,13.4,13.4,0,9.4,9.4,0 123,4-Apr-06,13.8,13.8,2.3,11.4,11.4,3.1 123,11-Apr-06,15,15,0.4,11.9,11.9,0 123,18-Apr-06,14.2,14.2,4.7,13.1,13.1,3.5 123,25-Apr-06,10.9,10.9,6.2,9.4,9.4,6.4 123,2-May-06,12.8,12.8,12.1,12.8,12.8,12.5 123,9-May-06,17,17,8.2,16.5,16.5,8.4 |
Supported PET File Formats
The following provides a summary of the PET file formats that are supported by MUSIC.
Daily/Monthly PET Text (.txt)
A comma delimited, fixed format file type. Contains a header line plus 12 additional rows of PET data - one for each month of the year. The columns of data that are required in each row are summarised below:
Column | DESCRIPTION |
|---|---|
1 | Station name/number, |
2 | Year, (e.g., 2001) |
3 | Month, (integer value from 1 to 12) |
4 | Reading type and units, (e.g., Evaporation to 9am (mm)) |
5 | Mean, (mean PET for the month) |
6 | Max, (maximum PET for the month) |
7 | Min, (minimum PET for the month) |
8 | Total, (total PET for the month) |
9 | Number of Observations, (number of days in this month) |
10-38/41 | Daily PET data, one daily PET value separated by commas |
An example of a PET text file is provided below:
STN_NUM,YEAR,MONTH,NameAndUnit,Mean,Max,Min,Total,Number of Obs,1,2,3,4,5,6,7,8,9,10,11,12,13,14,15,16,17,18,19,20,21,22,23,24,25,26,27,28,29,30,31 Monthly User Defined,2001,1,Evaporation to 9am (mm), 5.65, 5.65, 5.65,175.00, 31, 5.65, 5.65, 5.65, 5.65, 5.65, 5.65, 5.65, 5.65, 5.65, 5.65, 5.65, 5.65, 5.65, 5.65, 5.65, 5.65, 5.65, 5.65, 5.65, 5.65, 5.65, 5.65, 5.65, 5.65, 5.65, 5.65, 5.65, 5.65, 5.65, 5.65, 5.65 Monthly User Defined,2001,2,Evaporation to 9am (mm), 4.82, 4.82, 4.82,135.00, 28, 4.82, 4.82, 4.82, 4.82, 4.82, 4.82, 4.82, 4.82, 4.82, 4.82, 4.82, 4.82, 4.82, 4.82, 4.82, 4.82, 4.82, 4.82, 4.82, 4.82, 4.82, 4.82, 4.82, 4.82, 4.82, 4.82, 4.82, 4.82 Monthly User Defined,2001,3,Evaporation to 9am (mm), 3.87, 3.87, 3.87,120.00, 31, 3.87, 3.87, 3.87, 3.87, 3.87, 3.87, 3.87, 3.87, 3.87, 3.87, 3.87, 3.87, 3.87, 3.87, 3.87, 3.87, 3.87, 3.87, 3.87, 3.87, 3.87, 3.87, 3.87, 3.87, 3.87, 3.87, 3.87, 3.87, 3.87, 3.87, 3.87 Monthly User Defined,2001,4,Evaporation to 9am (mm), 2.67, 2.67, 2.67,80.00, 30, 2.67, 2.67, 2.67, 2.67, 2.67, 2.67, 2.67, 2.67, 2.67, 2.67, 2.67, 2.67, 2.67, 2.67, 2.67, 2.67, 2.67, 2.67, 2.67, 2.67, 2.67, 2.67, 2.67, 2.67, 2.67, 2.67, 2.67, 2.67, 2.67, 2.67 Monthly User Defined,2001,5,Evaporation to 9am (mm), 1.61, 1.61, 1.61,50.00, 31, 1.61, 1.61, 1.61, 1.61, 1.61, 1.61, 1.61, 1.61, 1.61, 1.61, 1.61, 1.61, 1.61, 1.61, 1.61, 1.61, 1.61, 1.61, 1.61, 1.61, 1.61, 1.61, 1.61, 1.61, 1.61, 1.61, 1.61, 1.61, 1.61, 1.61, 1.61 Monthly User Defined,2001,7,Evaporation to 9am (mm), 1.29, 1.29, 1.29,40.00, 31, 1.29, 1.29, 1.29, 1.29, 1.29, 1.29, 1.29, 1.29, 1.29, 1.29, 1.29, 1.29, 1.29, 1.29, 1.29, 1.29, 1.29, 1.29, 1.29, 1.29, 1.29, 1.29, 1.29, 1.29, 1.29, 1.29, 1.29, 1.29, 1.29, 1.29, 1.29 Monthly User Defined,2001,8,Evaporation to 9am (mm), 1.77, 1.77, 1.77,55.00, 31, 1.77, 1.77, 1.77, 1.77, 1.77, 1.77, 1.77, 1.77, 1.77, 1.77, 1.77, 1.77, 1.77, 1.77, 1.77, 1.77, 1.77, 1.77, 1.77, 1.77, 1.77, 1.77, 1.77, 1.77, 1.77, 1.77, 1.77, 1.77, 1.77, 1.77, 1.77 Monthly User Defined,2001,9,Evaporation to 9am (mm), 3.00, 3.00, 3.00,90.00, 30, 3.00, 3.00, 3.00, 3.00, 3.00, 3.00, 3.00, 3.00, 3.00, 3.00, 3.00, 3.00, 3.00, 3.00, 3.00, 3.00, 3.00, 3.00, 3.00, 3.00, 3.00, 3.00, 3.00, 3.00, 3.00, 3.00, 3.00, 3.00, 3.00, 3.00 |
