IQQM Crop Demand Model 2
- teamcity (Deactivated)
- asatheesh (Unlicensed)
Analytics
The IQQM CropMod2 replicates the water requirements for a cropped area. This is a process-based model which allows you to simulate a farmer’s decision on the area to plant in each season (along with evapotranspiration of the different crop types) and generates a demand based on the maintenance of a target soil moisture level. You can also simulate rice irrigation by specifying ponding behaviour and return flows.
When configuring crop models, the first step is to specify the crops using the Crop Parameter dialog. Then, use the water user feature editor to configure the model.
Configuring generic crop settings
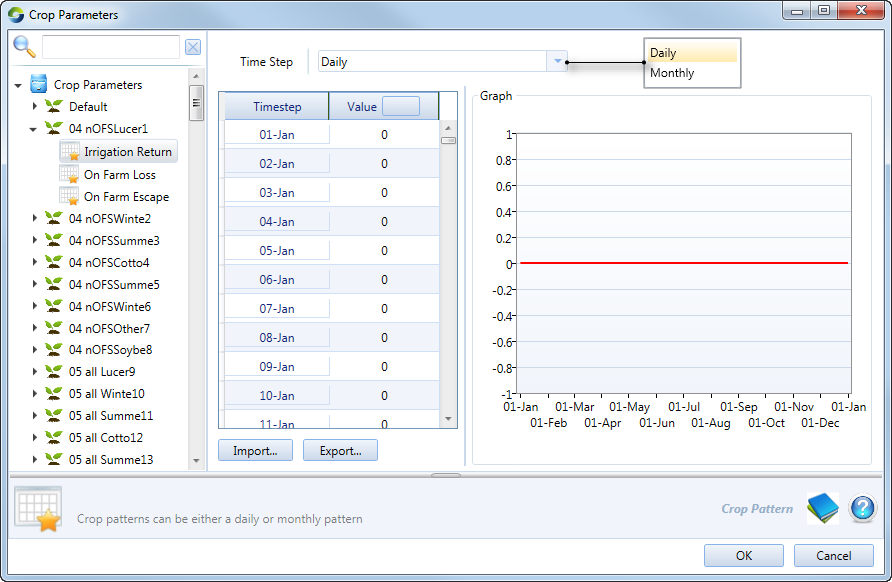
The Crop Parameters dialog shown in Figure 1 (accessible via ) allows you to specify crops and their associated parameters for the entire scenario. Crop parameters defined in this way are accessible for each water user node. This dialog is used to add crops (which can be imported via a .xml file), delete crops, and specify various parameters.
Figure 1. Crop Parameters

To add a new crop, right click Crop Parameters and choose Add Crop from the contextual menu. Figure 2 shows the resulting dialog. Note that the default for Use Pattern is OFF. Table 1 describes the parameters used in this dialog.
The method for defining crop parameters is based on FAO 56 which divides the growth period of every crop into four developmental stages based generally on water requirements. These stages are:
- Initial (or establishment) stage - occurs between planting and when there is approximately 10% ground cover. Water requirements are quite low and constant;
- Crop development (or vegetative) stage - sees a rapid increase in the amount of water required by the crop until there is generally about 70% to 80% ground cover and maximum rooting depth is achieved;
- Mid-season (or flowering) stage - requires the maximum amount of water in the life of the crop; and
- Late (or yield and/or ripening) stage - there is an approximate halving of water requirement as the crop ripens, reaches maturity and is harvested.
Figure 2. Crop Parameters, Default crop, Use Pattern Off

Table 1. Crop Model - Crop parameters
Parameter | Type | Description |
|---|---|---|
Repeats | integer | The growth pattern and duration is repeated by the specified number. For example a growth season of 5 months when repeated by a factor of 3 will have a growth period of 15 months. |
| Use Pattern |  | When toggled to ON, |
Is Ponded |
| When toggled to ON, the crop mix in the water user node for this crop type requires input for targets for minimum and maximum pond level. Levels are used as targets to irrigate and drain area as occurs for rice. |
Coefficient | Coefficients that define the straight lines connecting the four growth stages for the crop water requirements | |
Initial | Coefficient at start of the initial phase | |
Development | Coefficient at end of the initial phase and start of development phase | |
Mid-Season | Coefficient at end of the development phase and start of Mid-Season phase | |
Late-season | Coefficient at end of the Mid-Season phase and start of Late-Season phase | |
Maturity | Coefficient at end of the Late-Season phase | |
Growing days | days | Number of days within each stage of crop growth. |
Figure 3 shows the dialog when Use Pattern is toggled to ON. Daily time-step values can be entered manually or imported as a .csv file.
Figure 3. Crop Parameters, Crop, Use Pattern On

There are three parameters that can result in the water requirement being scaled up. Additional extractions are required if there is a practice of applying excess irrigation, with the excess being captured and returned to the water user storage. Additional extractions are also required if losses occur prior to delivery of extractions to the crop.
These parameters are:
- Irrigation return factor - Allows you to scale the on farm return factor defined through crop configuration. These two parameters combined, result in an increase in the volume ordered with the additional volume being available for returning to the water user storage;
- On farm loss factor - Allows you to scale the on farm loss factor defined through crop configuration. On-farm loss represents the percentage of water that is diverted from the river and passes the irrigators meter, but doesn’t make it to the cropped area and doesn’t reappear at any other point. An on farm loss will result in the volume ordered being increased and is applied after the irrigation return factor; and
- On farm escape factor - Allows you to scale the on farm escape factor defined through crop configuration. On-farm escape represents the percentage of diversions that is lost prior to being applied to crops however this flow returns to the river system at a confluence node. An on farm escape will result in the volume ordered being increased and is applied after the irrigation return factor and the on farm loss factor.
Figure 4 shows the dialog for the Irrigation return that can be configured for a crop. This dialog is similar for On Farm Loss and On Farm Escape.
Figure 4. Crop Parameters, Crop, Irrigation Return
Configuring crop models
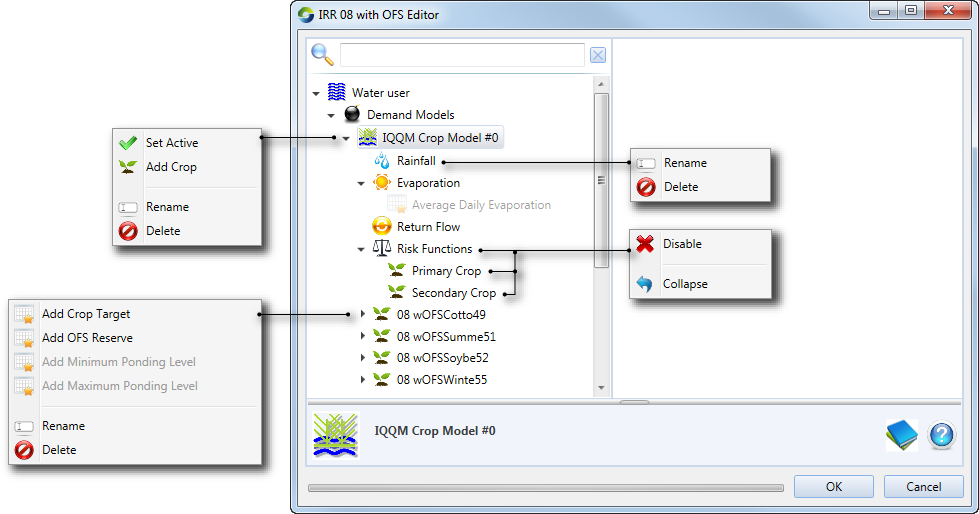
Once crops have been configured, use the water user feature editor to configure characteristics of the IQQM crop model (Figure 5).
Figure 5. IQQM crop model
The main IQQM Crop model panel (shown in Figure 6) is divided into three main sections:
- The Planted Area section broadly defines the area to be used and the proportions between the primary and secondary crops. Refer to Table 2 for information on the configurable parameters;
- The Primary Season Decision Date refers to the day when the water user decides the area of crop(s) to plant in the primary season. This should be before the Start Date of any specified primary crop, otherwise the area initially planted will be based on the primary crop decision from the previous year. Similarly, the Secondary Season Decision Date is the day when the water user decides the area of crop(s) to plant in the secondary season. Just like the primary season, this should be before the Start Date of any specified secondary crops; and
- The Soil section defines soil inputs. There are individual stores for each crop type. Areas that are not being cropped are referred to as fallow, and are simulated using two soil layers. Fallow area occurs between cropping seasons or during the irrigation season if the maximum developed area is not planted. At the end of a cropping season, the soil moisture of the crop area and fallow areas are merged. Table 3 provides a description of the parameters.
Figure 6. IQQM Crop Model, main
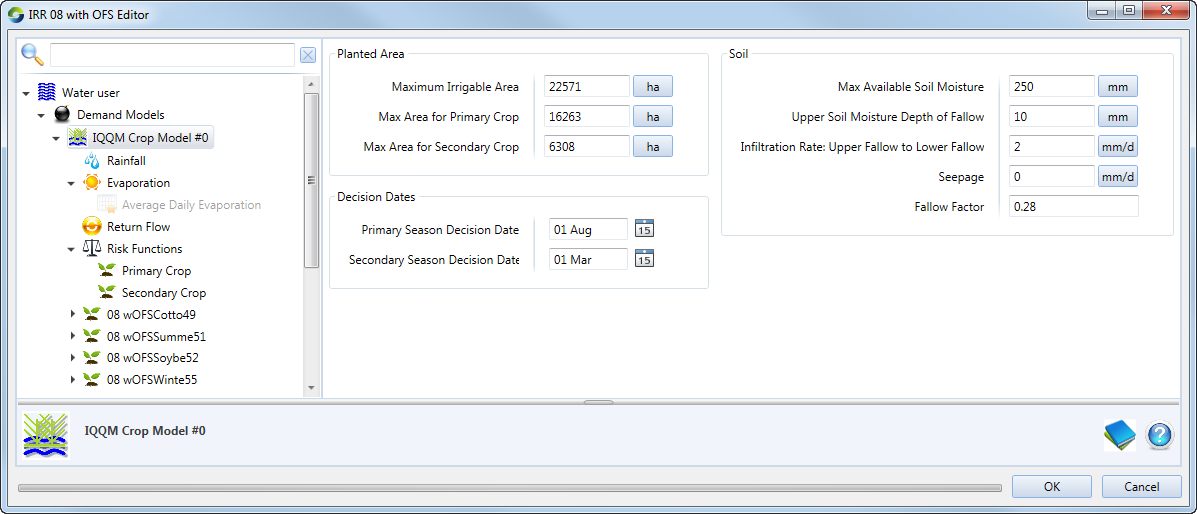
Table 2. IQQM Crop Model, Planted Area parameters
Parameter | Units | Description |
|---|---|---|
Maximum Irrigable Area | ha | Maximum area that can be planted. This value limits the total of primary and secondary crops, in case both crops are planted at the same time. |
Max Area for Primary Crop | ha | This is the maximum area that can be used in a simulation for all crops nominated as primary. A primary crop is one that is grown during the primary season, where there may be more than one crop type grown. This area cannot exceed the Maximum Irrigable Area. |
Max Area for Secondary Crop | ha | This is the maximum area to be used in a simulation for all crops nominated as "winter". A secondary crop is one that is grown during the winter months, which is defined in the crop mix (winter). This area cannot exceed the Maximum Irrigable Area. |
Table 3. IQQM Crop Model, Soil parameters
Parameter | Units | Description |
|---|---|---|
Max available soil moisture | mm | Depth of soil moisture available to the crop (field capacity). A soil moisture level of 0 represents the wilting point and the default settings will try to maintain a soil moisture level of half the field capacity. |
Upper soil moisture depth of Fallow | mm | Depth of the upper soil moisture store for fallow areas. The lower soil store depth is equal to the Maximum available soil moisture less Upper soil moisture depth. Upper soil moisture store cannot be greater than the depth of the Maximum available soil moisture. The upper store is depleted by evaporation and the lower store, by the seepage rate. Water can move from the upper store to the lower store at the Infiltration Rate. |
Infiltration rate from upper Fallow to lower Fallow | mm/d | The maximum rate of water movement from the upper soil moisture store to the lower moisture store. The actual infiltration rate is the product of this rate and the ratio of upper fallow moisture to upper fallow moisture capacity. |
Seepage | mm/d | The maximum rate at which water drains from the lower soil moisture store when the area is not irrigated (fallow). Soil moisture will be depleted by the product of this rate with the ratio of actual soil moisture to maximum soil moisture. |
Fallow factor | % | Crop factor for fallow ground. One value is used throughout the year. This factor is applied to the evaporation rate to determine the loss rate from the upper fallow area. |
Defining crops
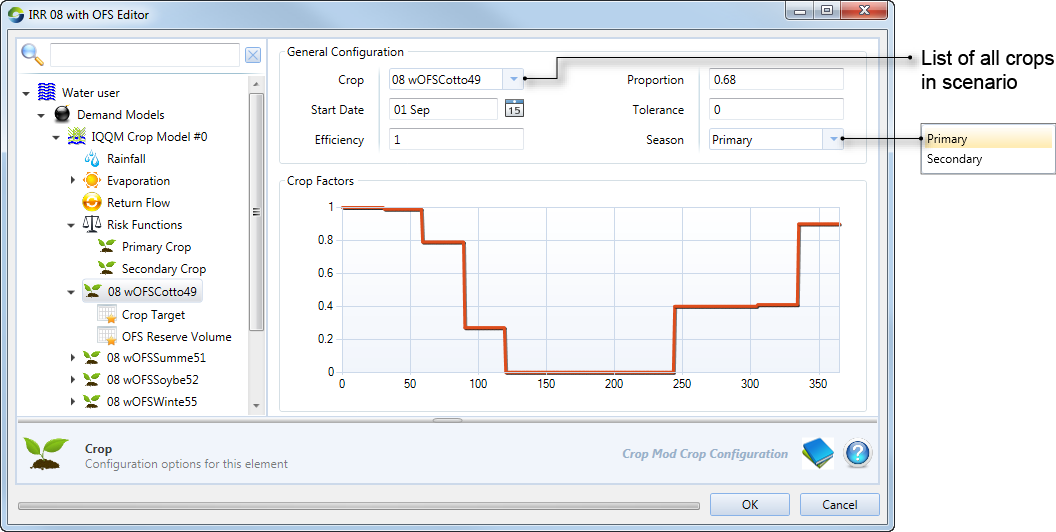
To define a crop, choose the crop type from the drop-down menu and specify and Start Date and Proportion of this crop type (shown in Figure 7). The season (either primary or secondary) must be chosen to specify the risk function to use. Note that at the start date, crop factors must not be zero to start crop demand and irrigation season.
Figure 7. IQQM Crop model, Crop
Climate
The IQQM Crop Model defines three parameters for climatic data:
- Rainfall - The model uses rainfall data to replenish soil moisture. Excess runoff can be re-used by the water user node. Rainfall may be input as monthly averages or daily data entered as a constant value, a time series, or as a function. Refer to Figure 8 for the dialog and Table 4 for parameter details;
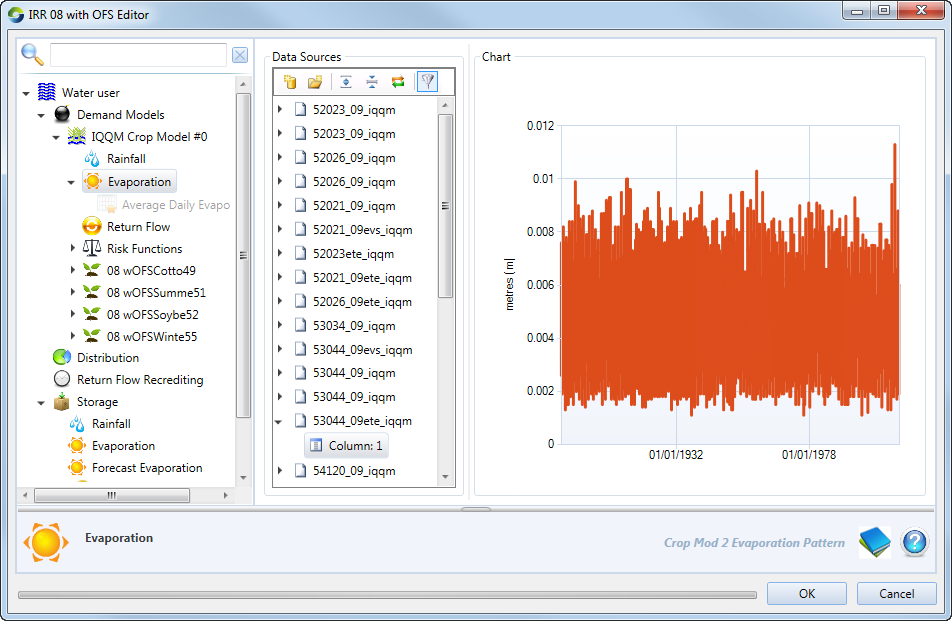
- Evaporation - The model uses pan evaporation with crop factors to calculate evapotranspiration volumes. Pan evaporation is input as a time series. Refer to Figure 9 for the dialog; and
- Average daily evaporation - Enter average daily pattern for reference crop evapotranspiration. The daily average is used to forecast crop demand. If no average evap data is added then an average for each day of the year (ie. 365 day pattern) is derived from the time series data.
Figure 8. IQQM Crop Model, Rainfall
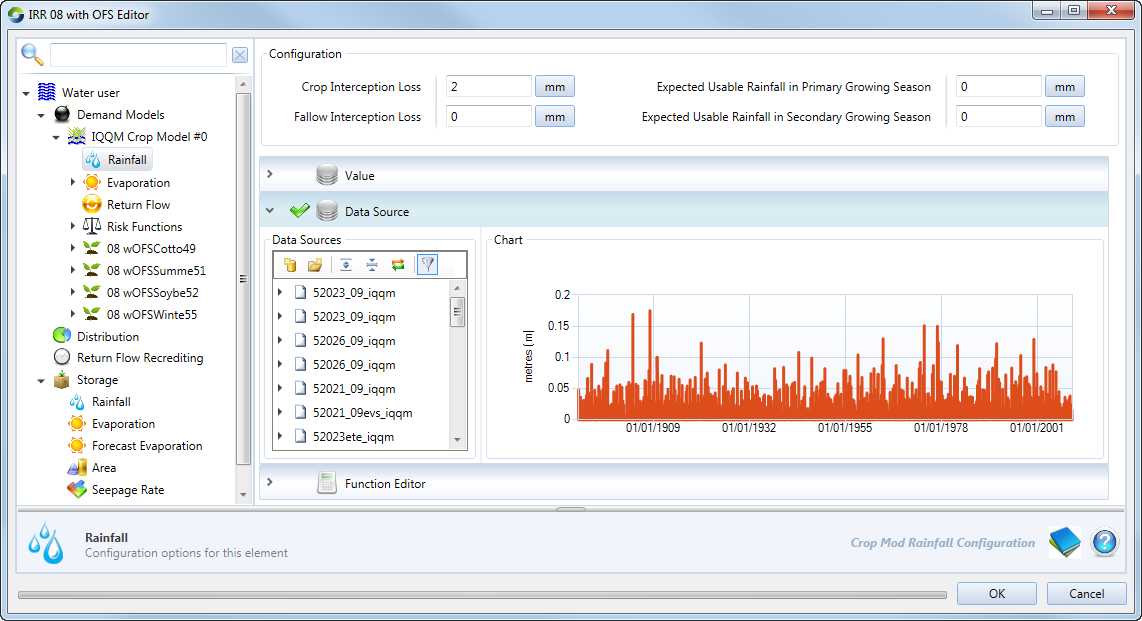
Table 4. IQQM Crop Model, Rainfall parameters
Parameter | Units | Description |
|---|---|---|
Crop interception loss | mm | The depth of rainfall intercepted by the vegetative cover of the crop. Effective rainfall onto crops is the actual rainfall less this interception loss. |
Fallow interception loss | mm | The depth of rainfall intercepted in fallow area. |
Expected usable rainfall in primary growing season | mm | Depth of usable rainfall available for use by a crop during the primary growing season. Usable rainfall is actual rainfall less allowance for runoff and interception losses. This value is used when calculating the area to be planted at the primary growing season decision date if the volume risk function method is used. |
Expected usable rainfall in secondary growing season | mm | Depth of usable rainfall available for use by a crop during the secondary growing season. Usable rainfall is actual rainfall less allowance for runoff and interception losses. This value is used when calculating the area to be planted at the secondary growing season decision date if the volume risk function method is used. |
Figure 9. IQQM Crop Model, Evaporation
Return flow
Return drainage water is surplus drainage water from irrigation or from rainfall runoff. This water can be redirected into the on farm storage or otherwise can be returned to the river via a confluence node. Figure 10 shows the dialog for Return flow and Table 5 describes the configurable parameters.
Figure 10. IQQM Crop Model, Return flow
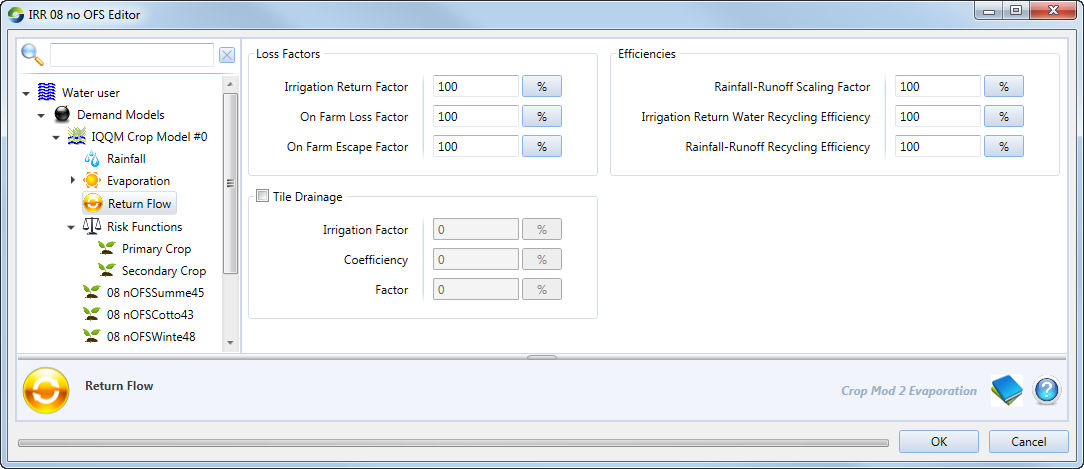
Table 5. IQQM Crop Model, Return flow parameters
| Parameter | Units | Description |
|---|---|---|
| Rainfall runoff scaling factor | % | The IQQM crop model includes a default rainfall runoff model and the scaling factor can be used to scale the runoff up or down. This factor should only be changed from 1.0 after careful thought, as it can impact irrigation demand calculations. If a factor greater than 1.0 is used runoff increases and infiltration is reduced. Similarly, if a factor less than 1.0 is used, runoff decreases and infiltration is increased. |
| Irrigation return water recycling efficiency | % | Percentage of irrigation return water that can be either pumped into the water user storage for re-use (subject to storage and pumping constraints) or directed back to the river. You determine the proportion that is diverted to the storage through the ‘harvestable return flow’ parameter for the storage. |
| Rainfall runoff recycling efficiency | % | Percentage of rainfall runoff that can either be pumped into the water user storage for re-use or directed back to the river. As per irrigation recycling, the proportion that is directed to the storage is dependent on the ‘harvestable return flow’ parameter for the storage. |
| Tile Drainage (TD) parameters | The tile drainage function allows drainage to be defined in terms of a regression relationship with rainfall and irrigation. The amount of tile drainage is estimated as TD (mm/d) = TD coefficient+TD rainfall factor•sum of previous 30 days rainfall (mm)+TD irrigation factor•sum of previous 30 days irrigation |
Risk functions
At the start of an irrigation season, each water user node decides on how much area is to be planted (and thus irrigated). This is determined by the Decision Date for the primary and secondary season. This calculation uses a relationship referred to as the farmer’s risk function. In the IQQM crop model, farmer’s risk is modelled in two different ways: an area-based approach and a volume-based one. For the former, the function relates available resource to planted area. For the latter, the function relates current the available resource to expected available resource. The expected available resource is then divided by the calculated average crop requirement to determine the planted area. Refer to the Source Scientific Reference Guide for more information.
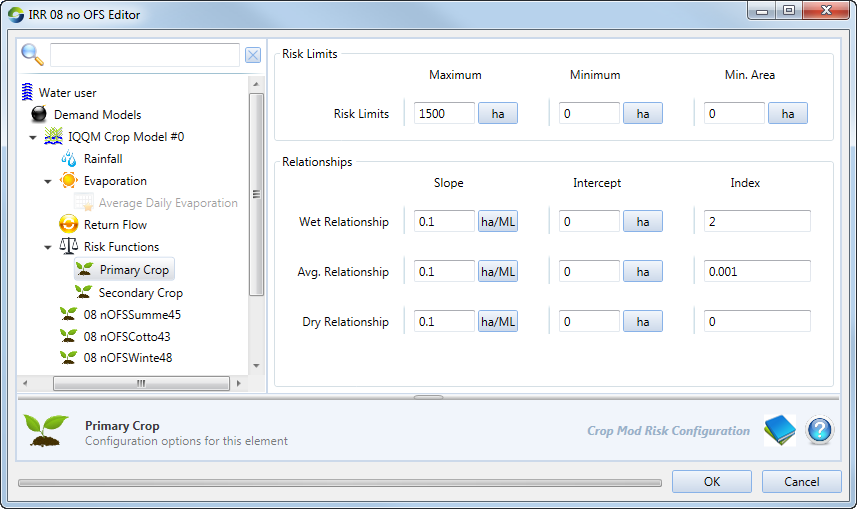
For both area and volume based risk functions, you must specify the wet, average and dry periods (using the Primary and Secondary crop dialog shown in Figure 13). The model interpolates between these values based on an index of current conditions. For the area based method, the model automatically calculates the index based on soil moisture. For the volume based method, the index is calculated based on the defined inflow data as follows:
- Inflow time series - If the Risk Function type is volume, specify inflow as a constant value, a time series data or as a function (Figure 11); or
- Median prior 6-Monthly Inflow - Long term average inflows are entered as a monthly time-step (Figure 12). The volume based risk function uses an inflow inde,x based on the supplied time series data. The index compares the total inflow from the time series file in the preceding 183 day period to the long term average for the same period.
Figure 11. IQQM Crop Model, Risk functions, Inflow time series
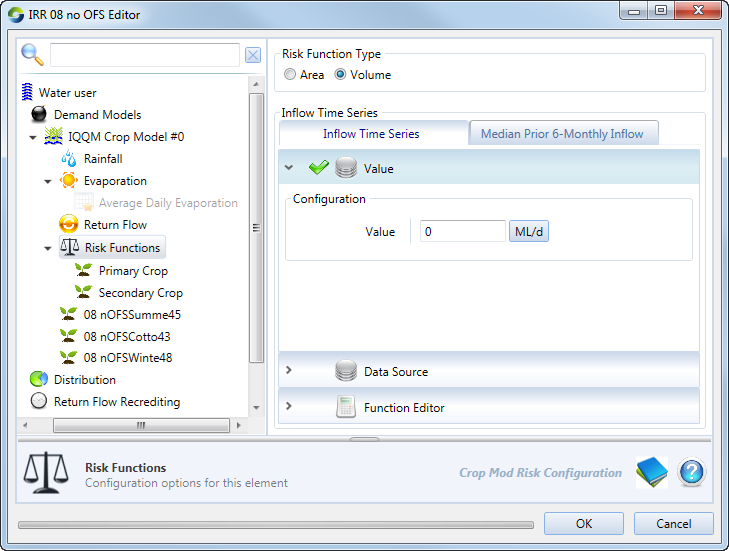
Figure 12. IQQM Crop Model, Risk functions, Median prior 6-Monthly inflow
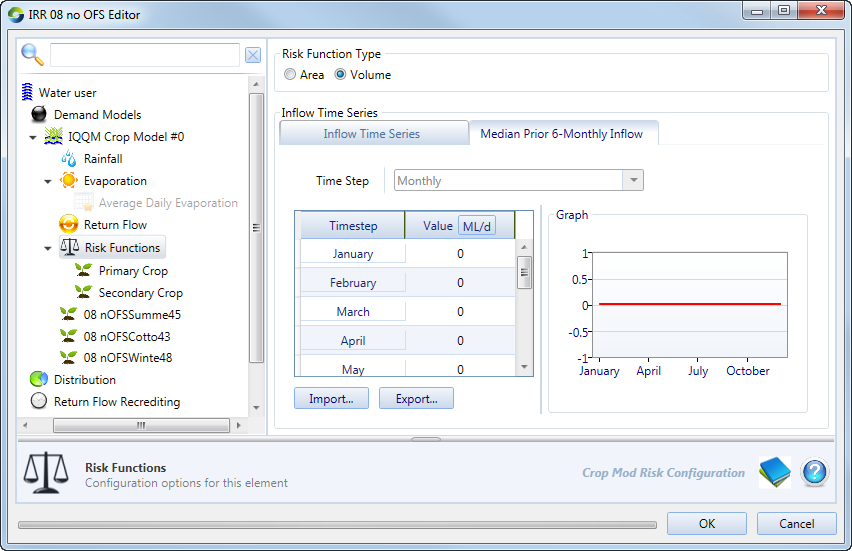
Figure 13. IQQM Crop Model, Risk Functions, Primary Crop
Crop Target
OFS Reserve volume
This is used to satisfy crop demands during dry periods and long travel times for ordered water. It can be specified at either daily or monthly time-steps.
